Coaching Dashboard - Turning Data into Sales Action
"Multi-level insights to drive sales performance"

Coaching Dashboard - Turning Data into Sales Action
"Multi-level insights to drive sales performance"
Problem Statement
Sales managers lacked a structured way to evaluate conversations and coach their teams effectively.
Performance insights were scattered, high-level, or time-consuming to analyze, making it difficult to identify skill gaps, track improvement, and deliver timely, data-driven coaching at scale.
The challenge was to "design a coaching dashboard that transforms conversation data into clear, multi-level, and actionable insights for both managers and reps."
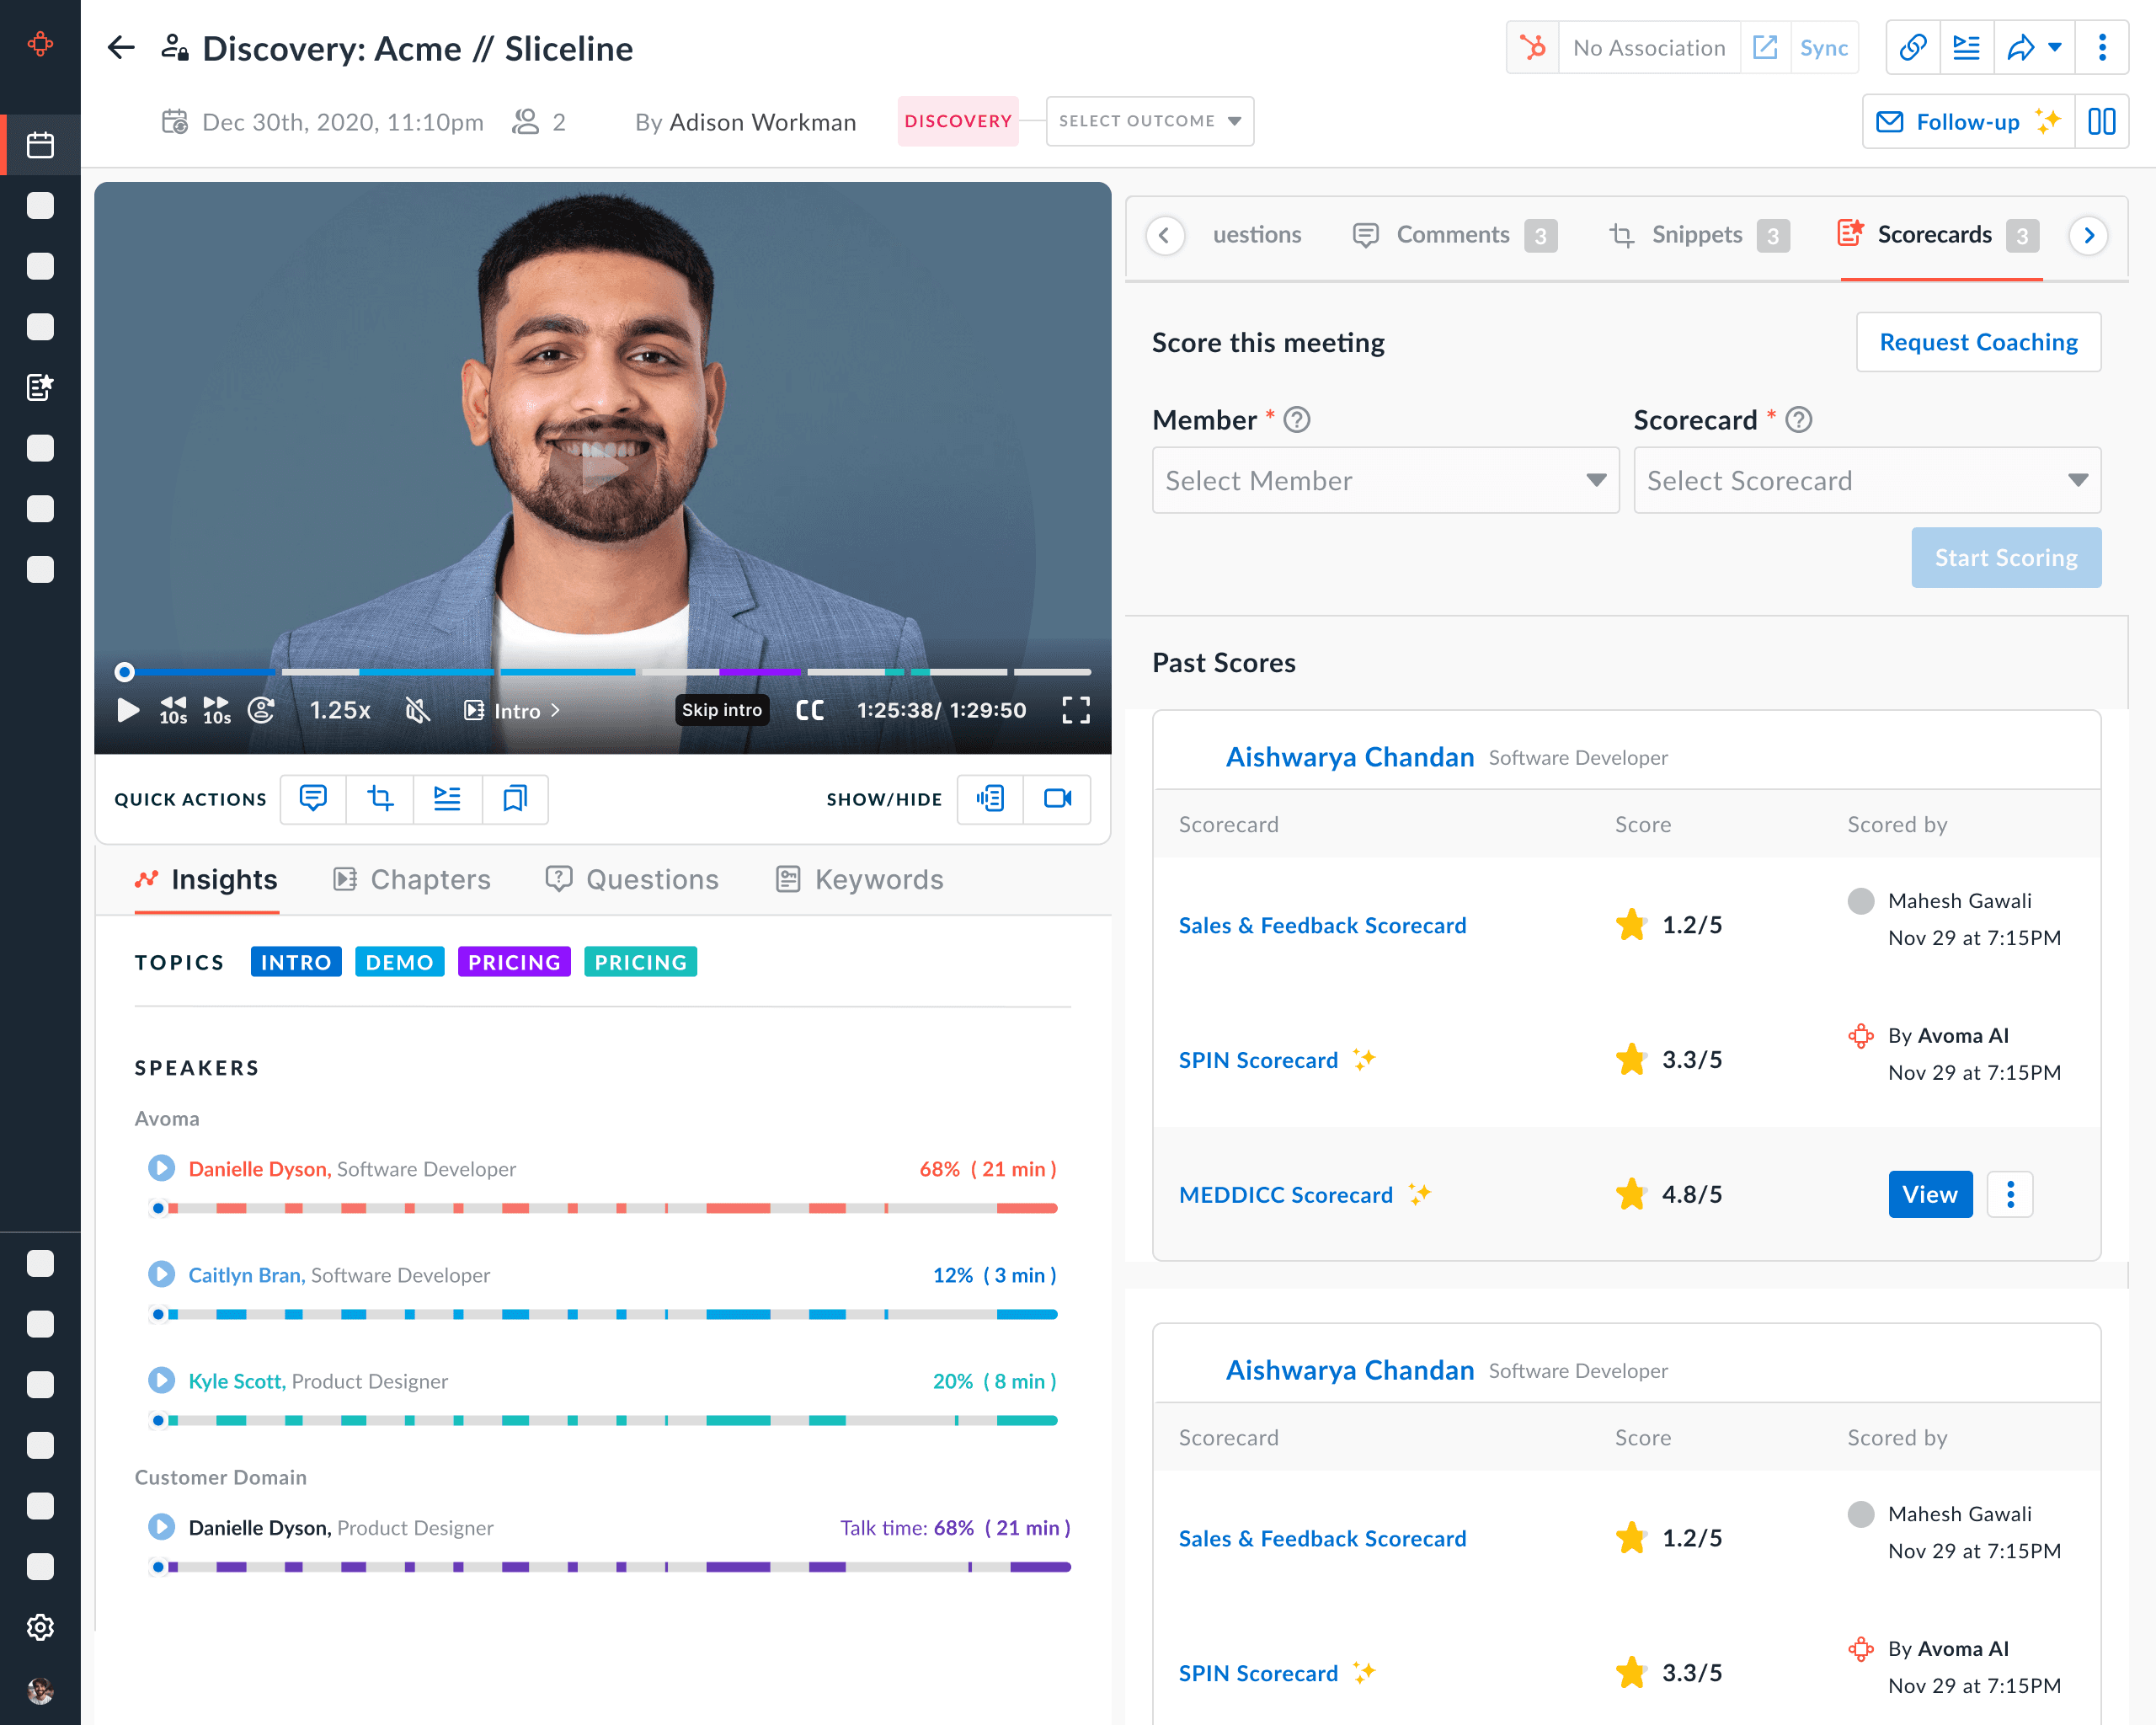
Challenges with existing solution
Managers had to go inside the conversation to view insights for each team member.
Managers could not compare how their team members are performing.
Proposed Solution
Design a multi-level coaching dashboard that converts conversation data into clear performance insights, enabling managers to quickly identify gaps, track progress, and deliver targeted coaching.
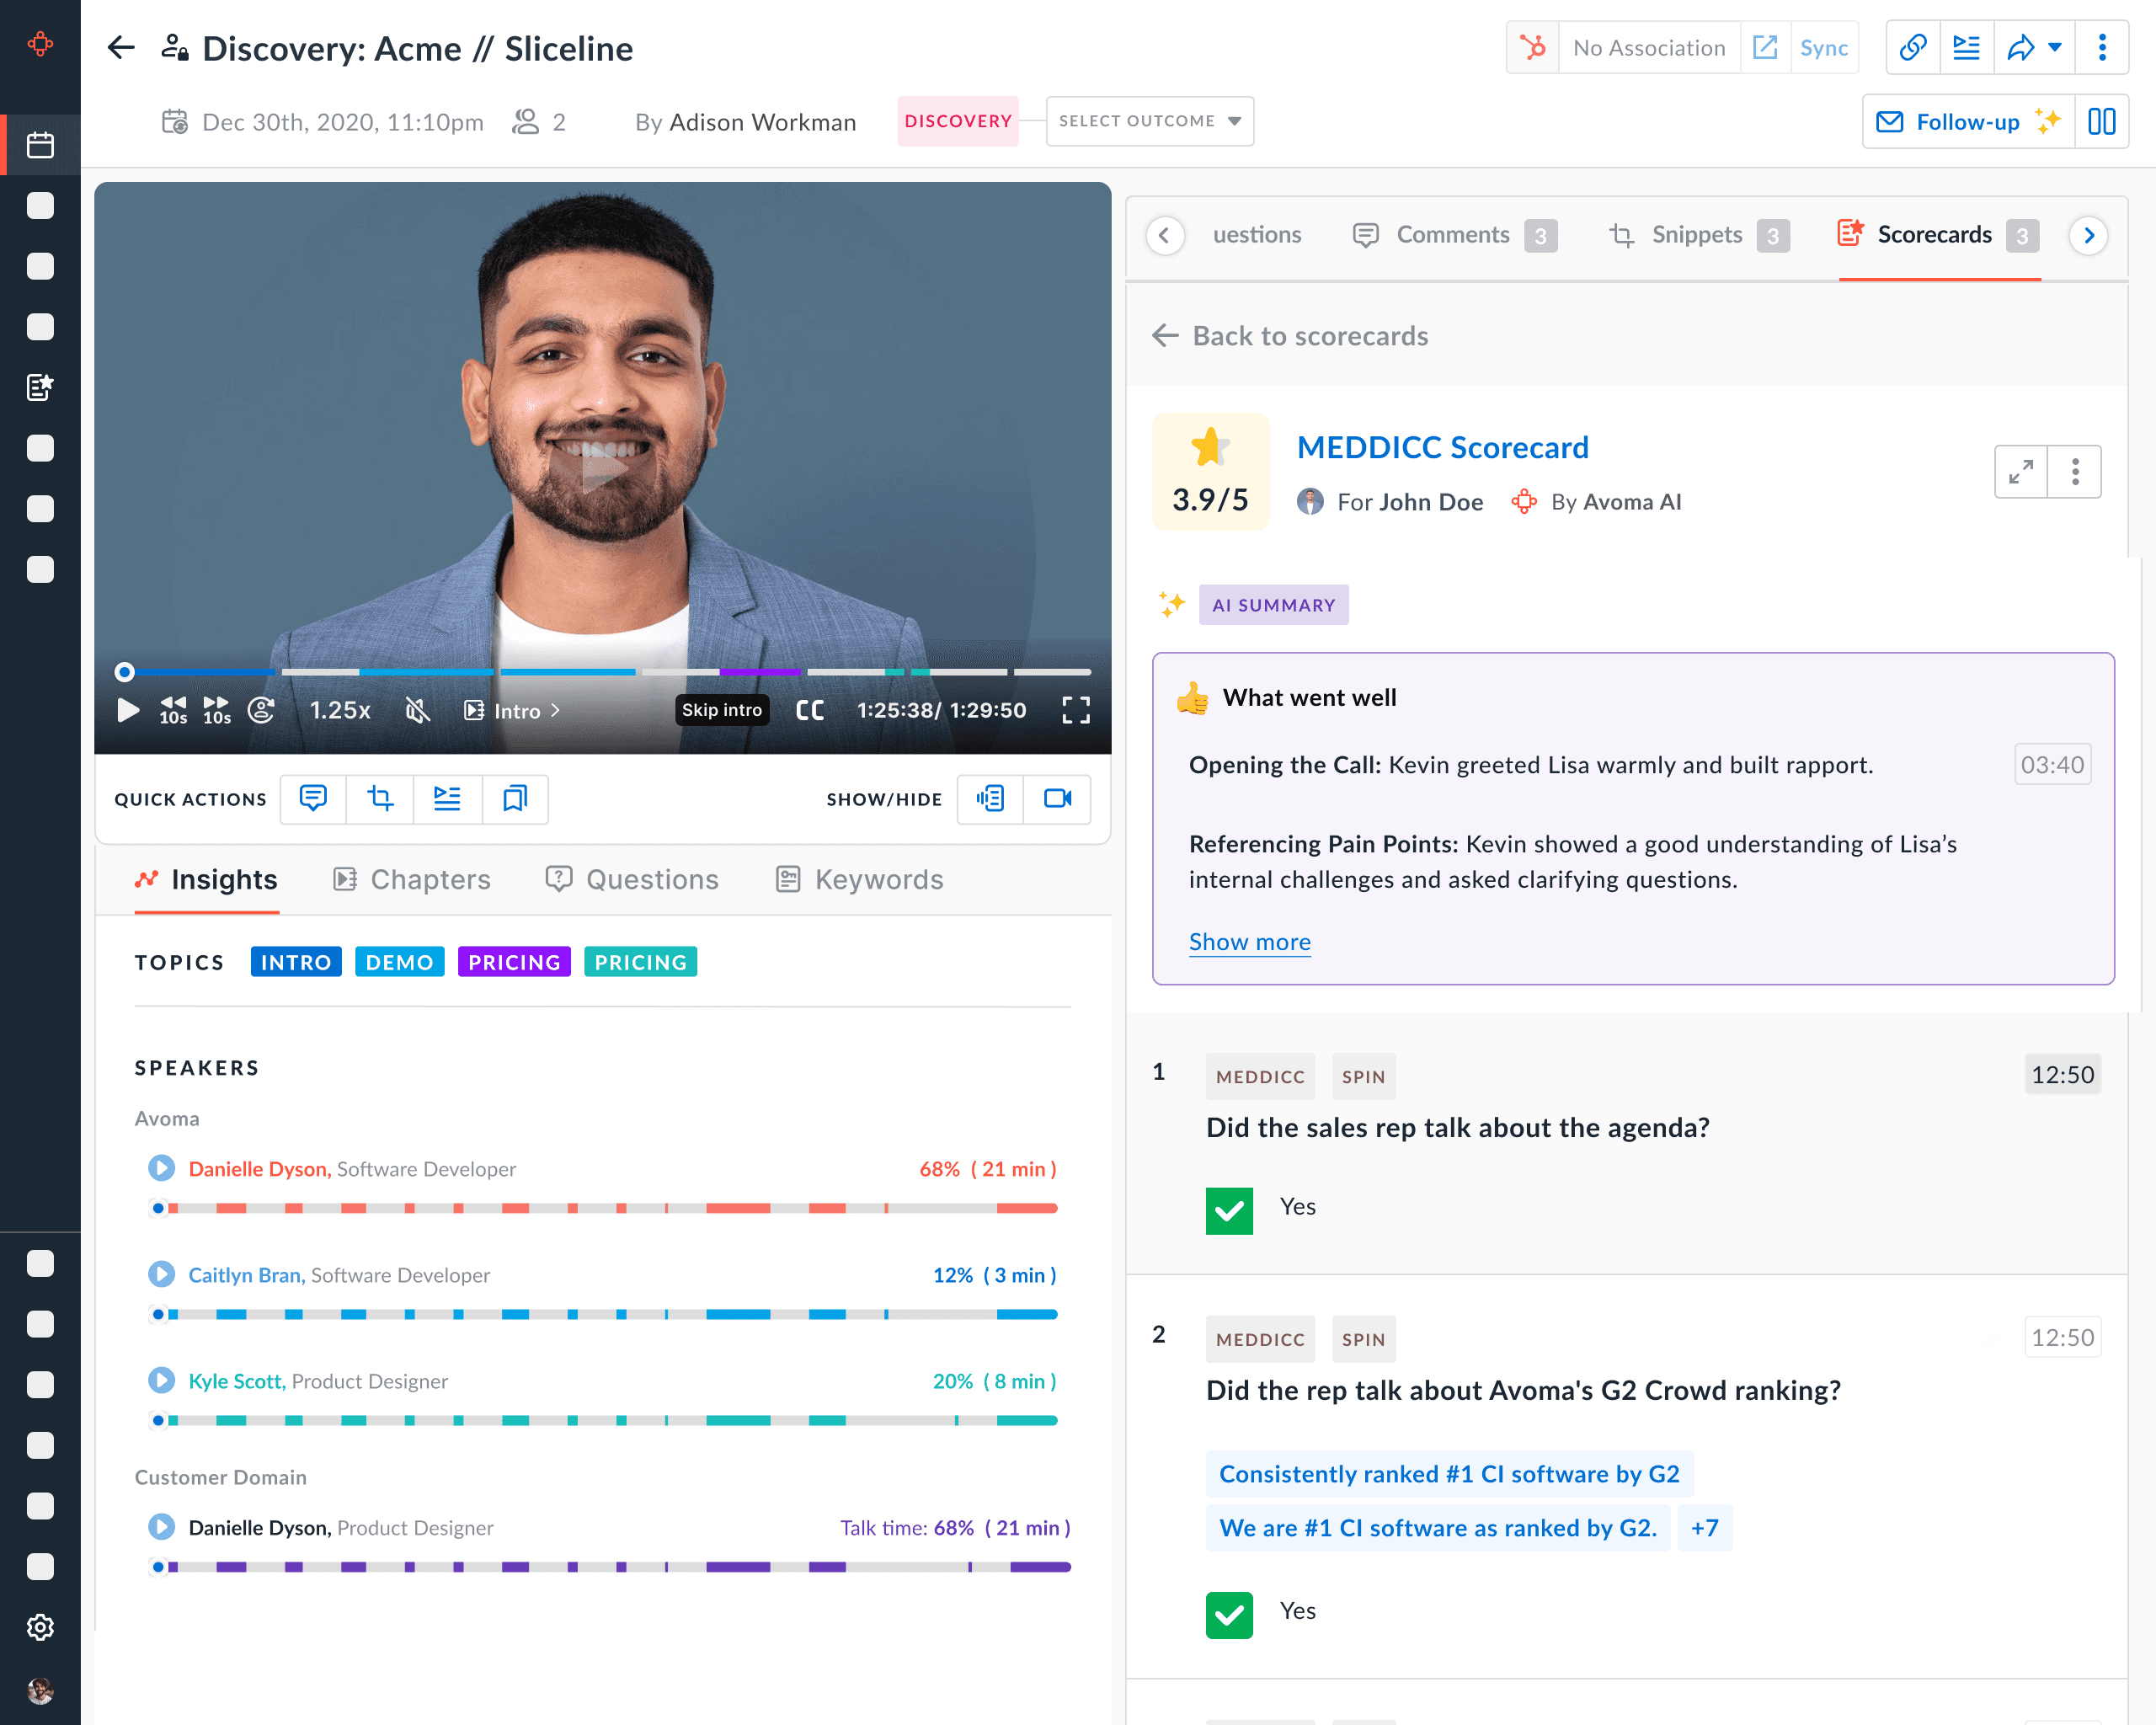
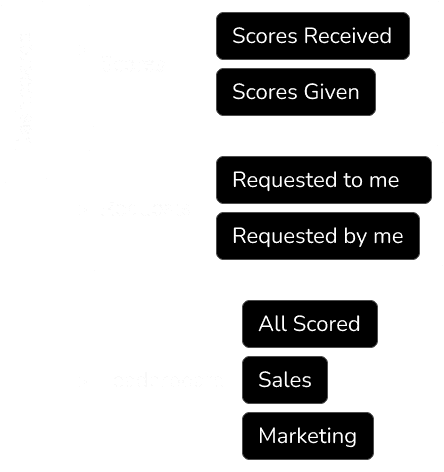
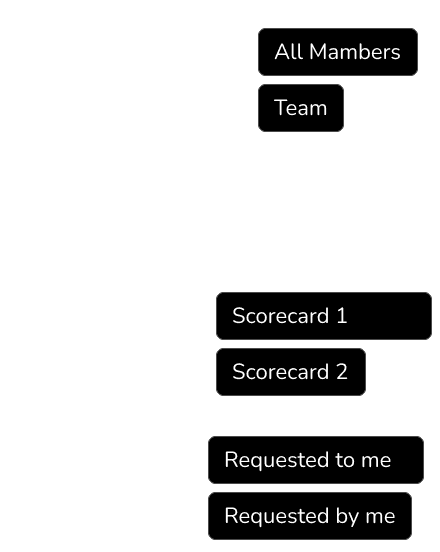
Wireframes
Our goal was to visualise all the members in dedicated place so managers can quickly see insights related to their team members.
We started with balsamiq to create quick wireframes.


Wireframes
Our goal was to visualise all the members in dedicated place so managers can quickly see insights related to their team members.
We started with balsamiq to create quick wireframes.
Version 1 :
Initially we visualised very simple dashboards showing all members in list form.

Challenges
Not very playful or intuitive.
Not able to see the progress for members over certain time period


Version 1 :
Initially we visualised very simple dashboards showing all members in list form.
Challenges
Not very playful or intuitive.
Not able to see the progress for members over certain time period
Version 2 :
Architecture changed as below.
Challenges
Repetitive Dashboards
Still very data heavy and not intuitive.

Version 2 :
Architecture changed as below.
Challenges
Repetitive Dashboards
Still very data heavy and not intuitive.
Version 3
Architecture changed as below.
Challenges
Better version as compared to last two, still was not very catchy.
Sizes of charts were too small. Had accessibility issues.
Version 3
Architecture changed as below.
Challenges
Better version as compared to last two, still was not very catchy.
Sizes of charts were too small. Had accessibility issues.
Version 4
Final Architecture
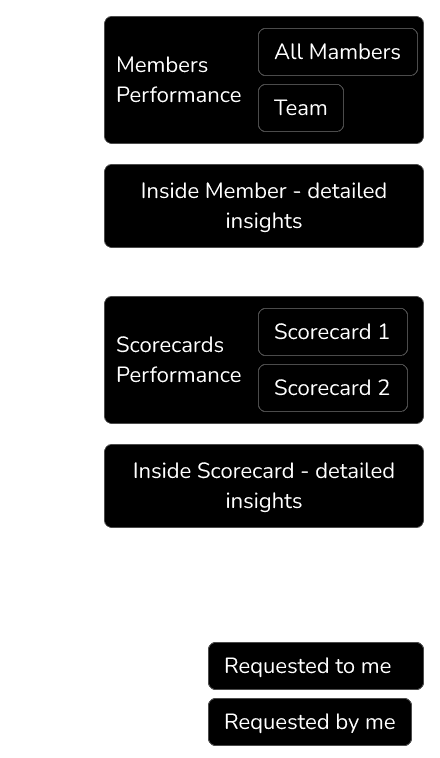
Challenges
Better architecture wise, still needs improvements on visuals
Version 4
Final Architecture
Challenges
Better architecture wise, still needs improvements on visuals
Feedback from Customers & Stakeholders
In the table I feel we should add a few more things
Scorecard form name || no of Questions (Hover to show the preview of the questions from this scorecard)
Total Conversations scored (Show help text: Conversations scored under that scorecard)
Average score (Show % of growth as compared to last week) (Show help text: Average score for that scorecard)
Highest score (hover to show the meeting details and open in new tab CTA)
Last 5 scores +More (Where I can hover over each score for meeting details and hover over more to see the list view of 20 more meetings with scores)
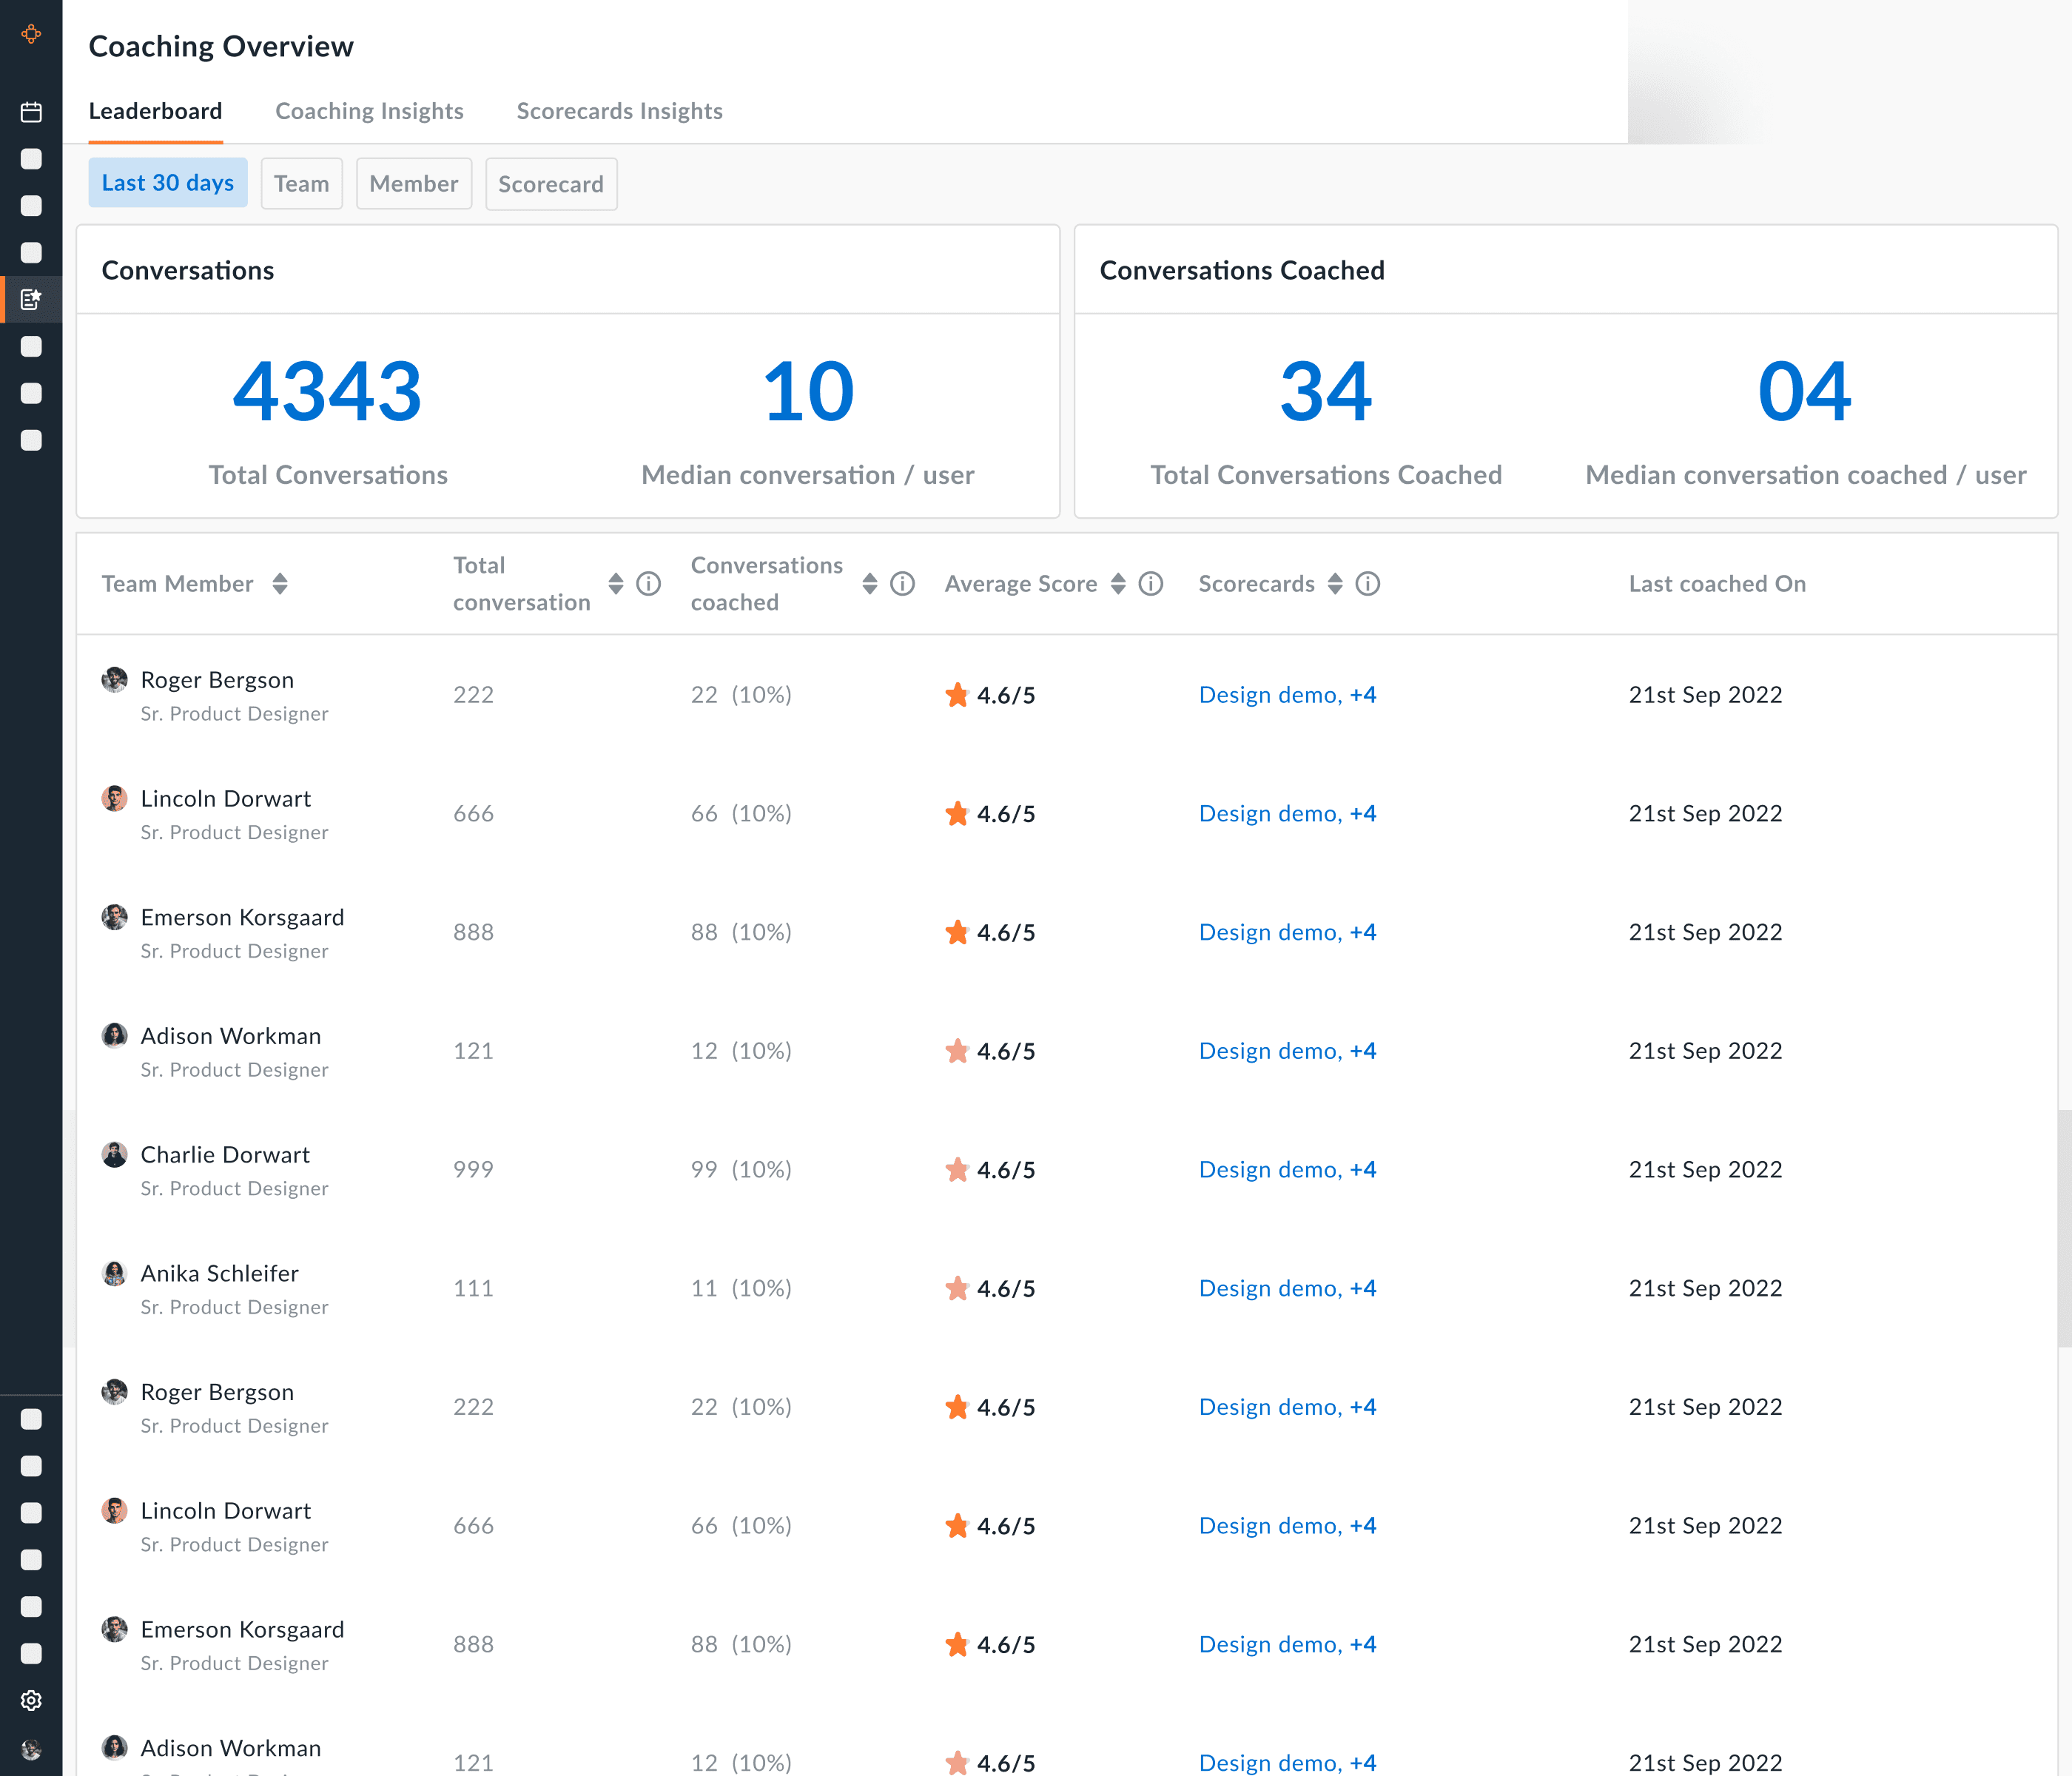
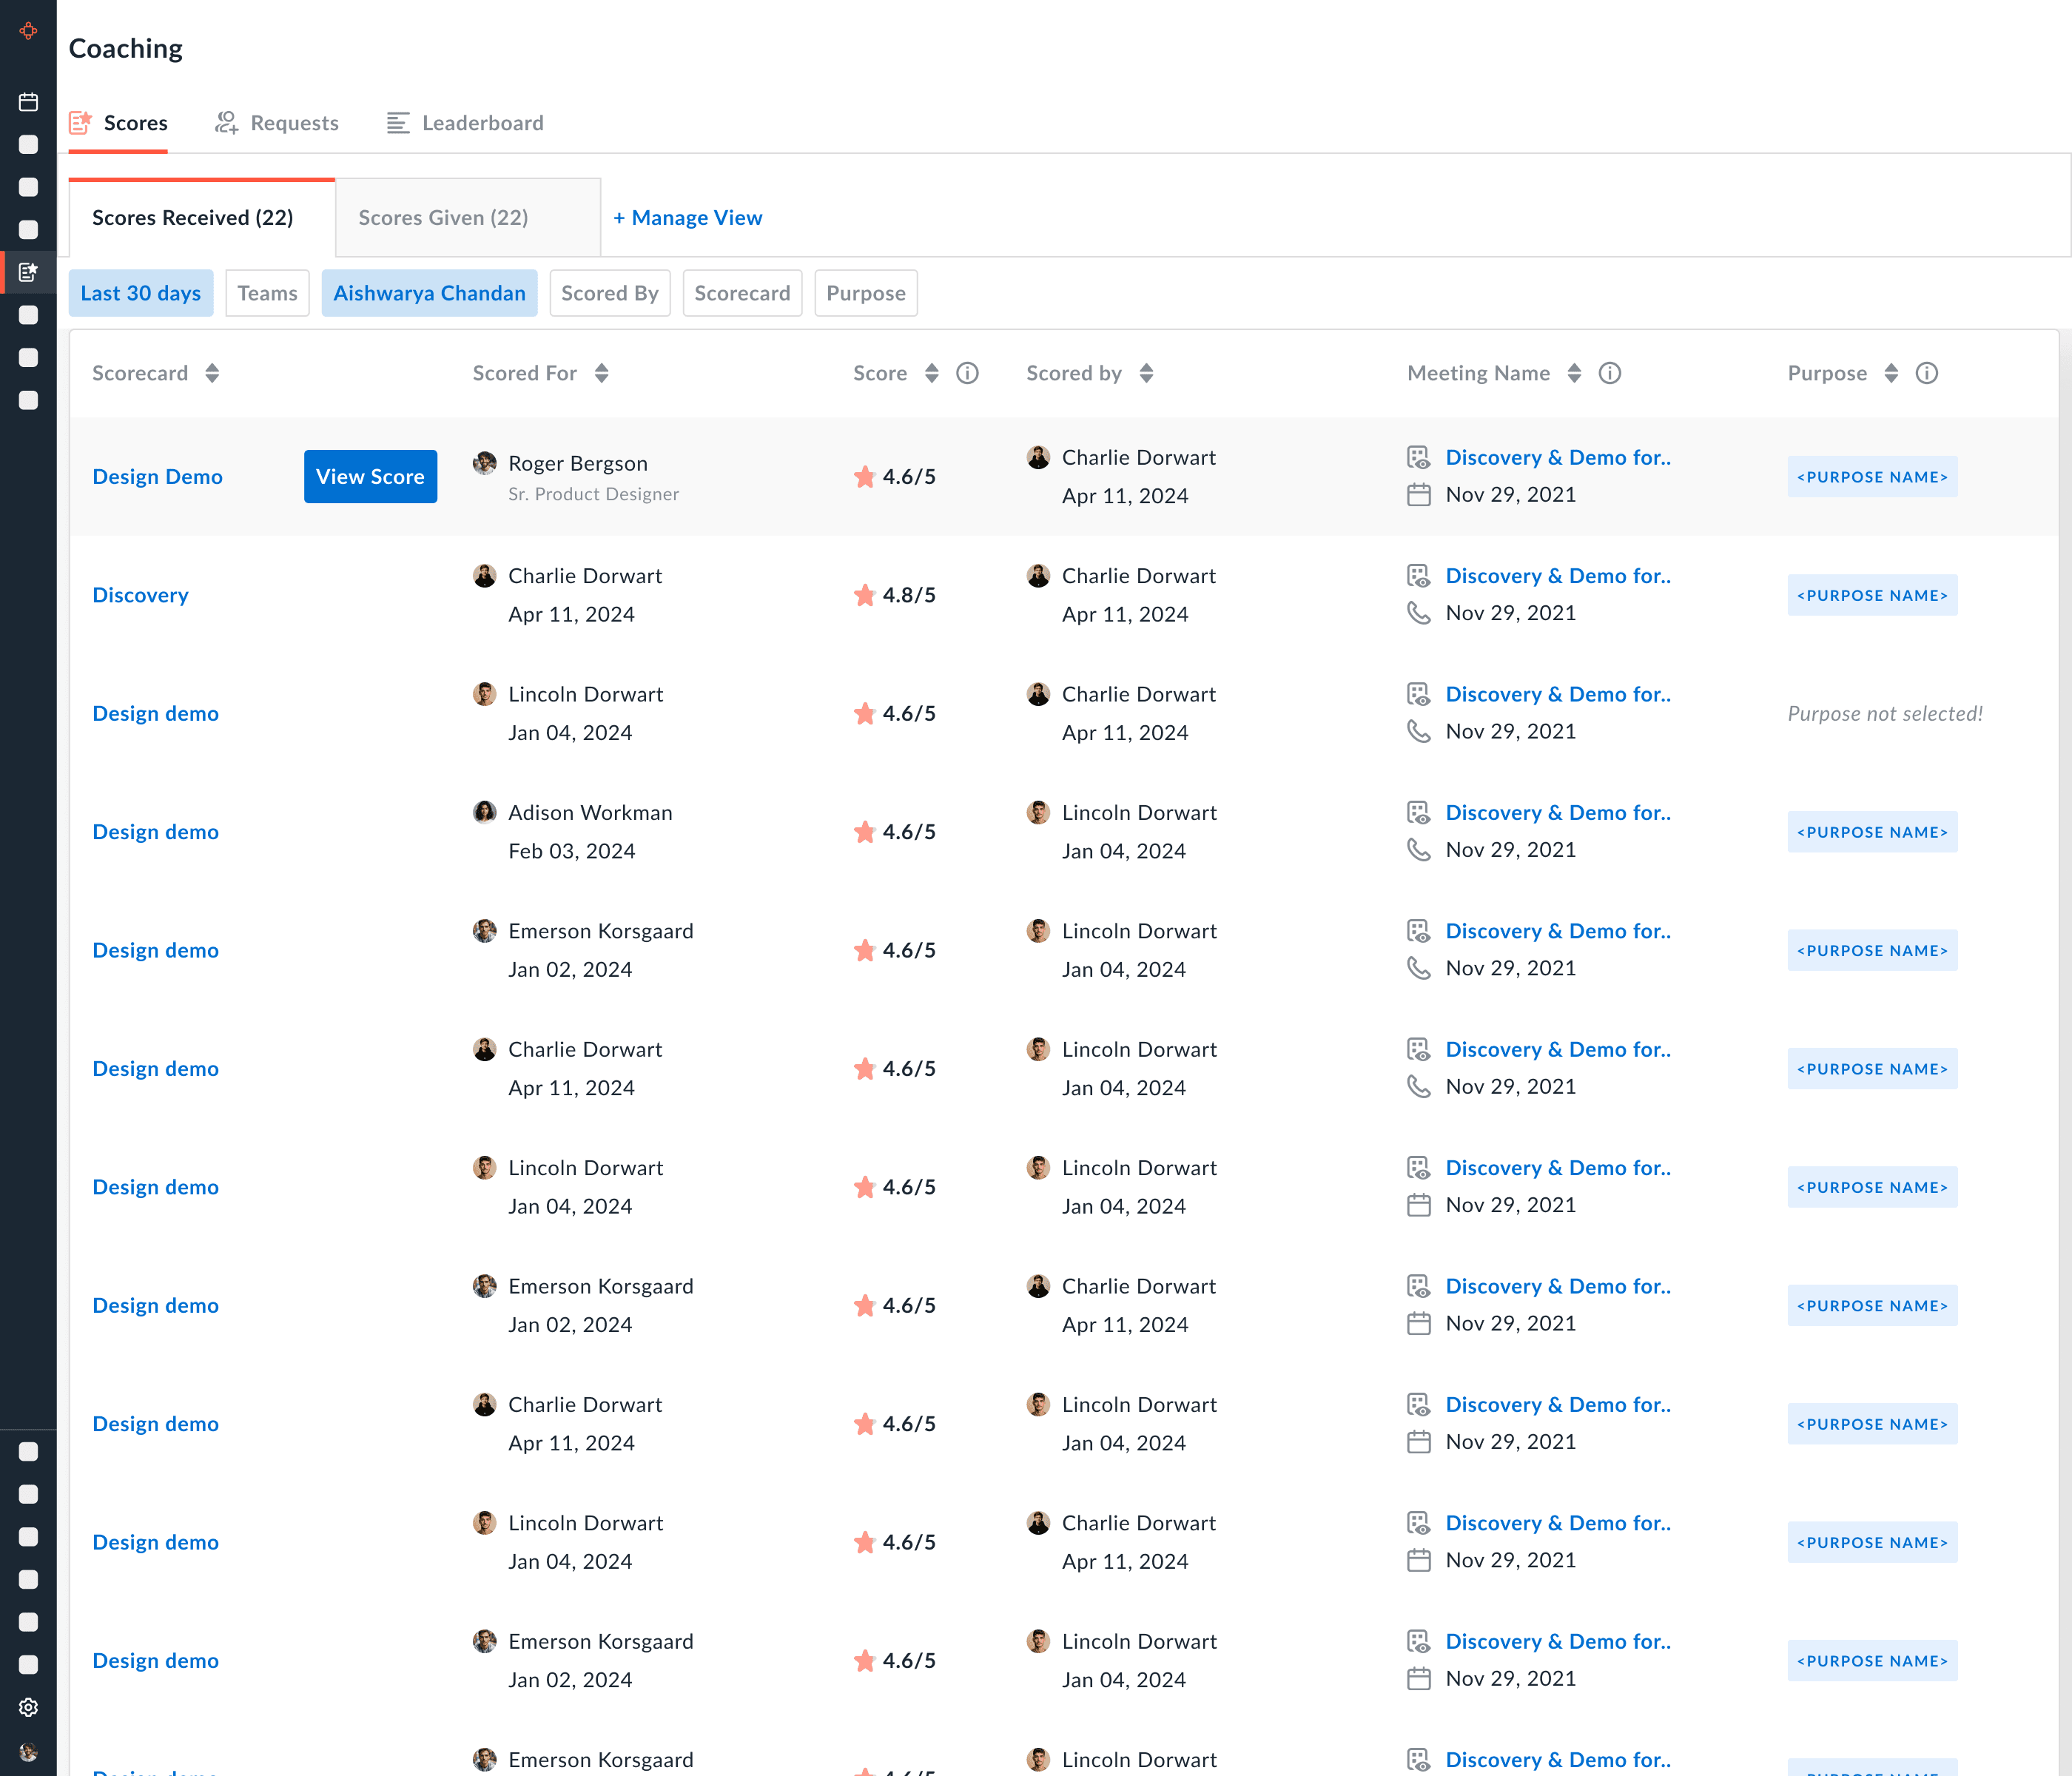
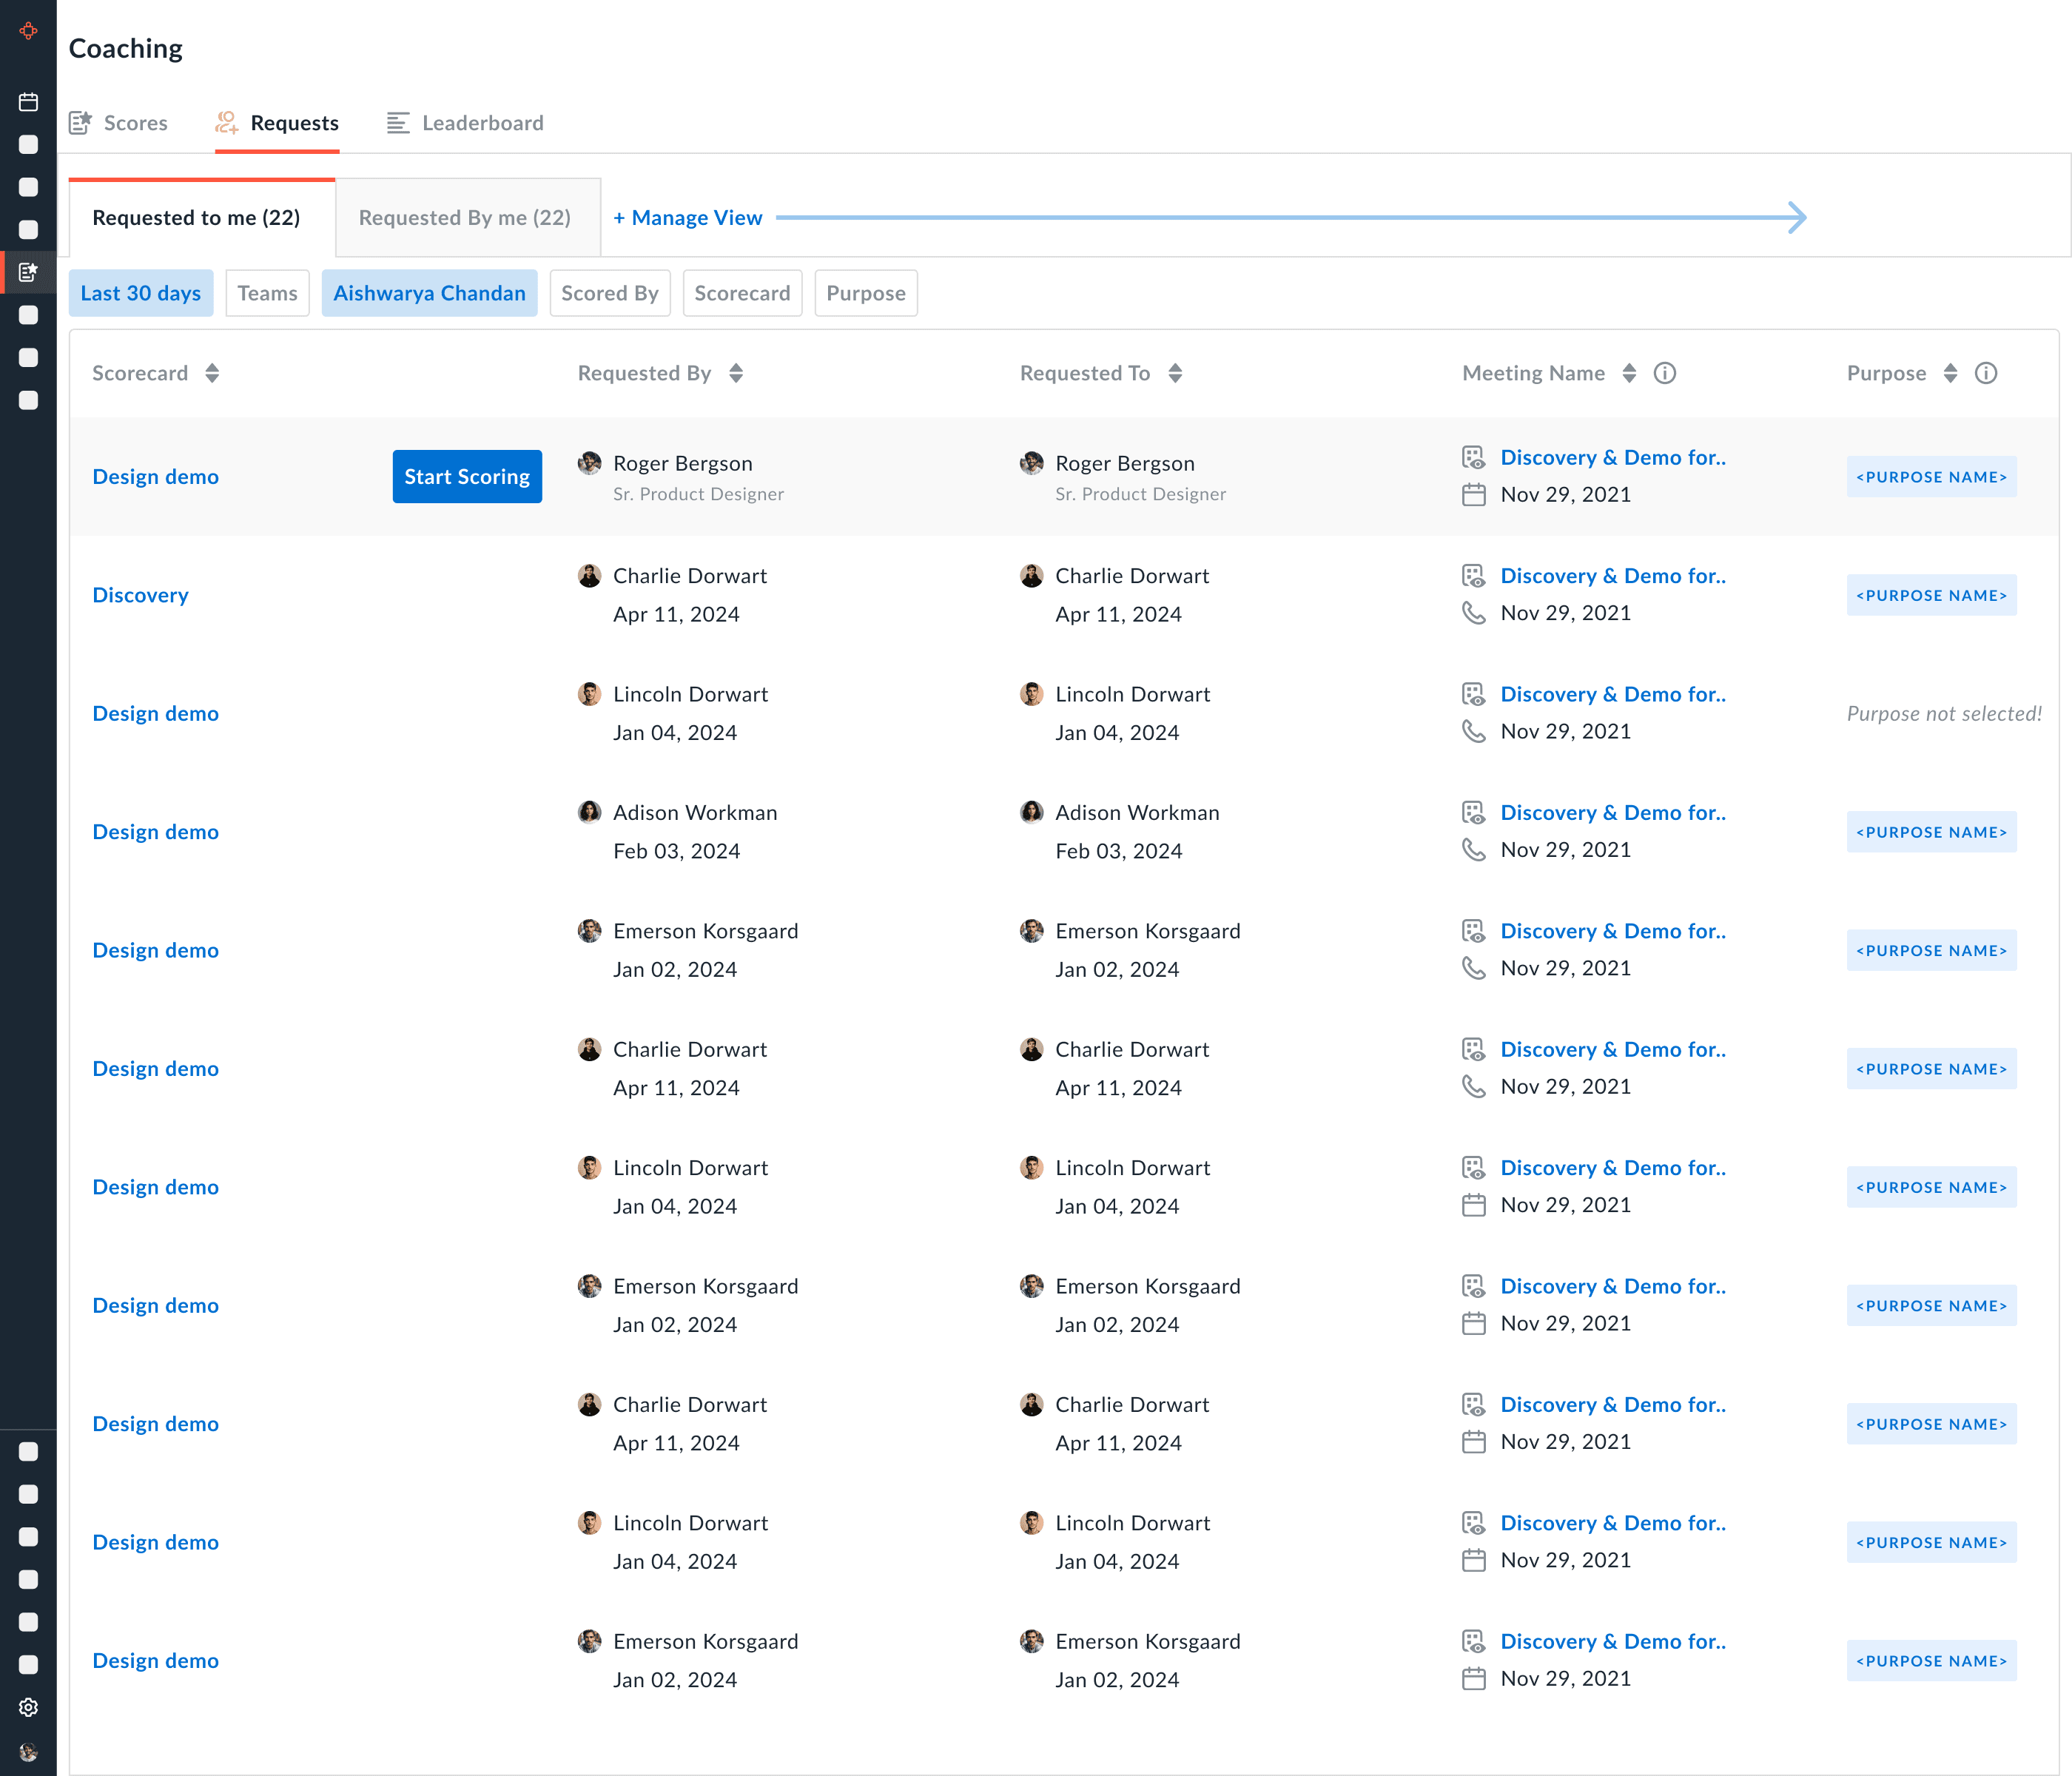
Final Version
"Overview"

Final Version
"Overview"
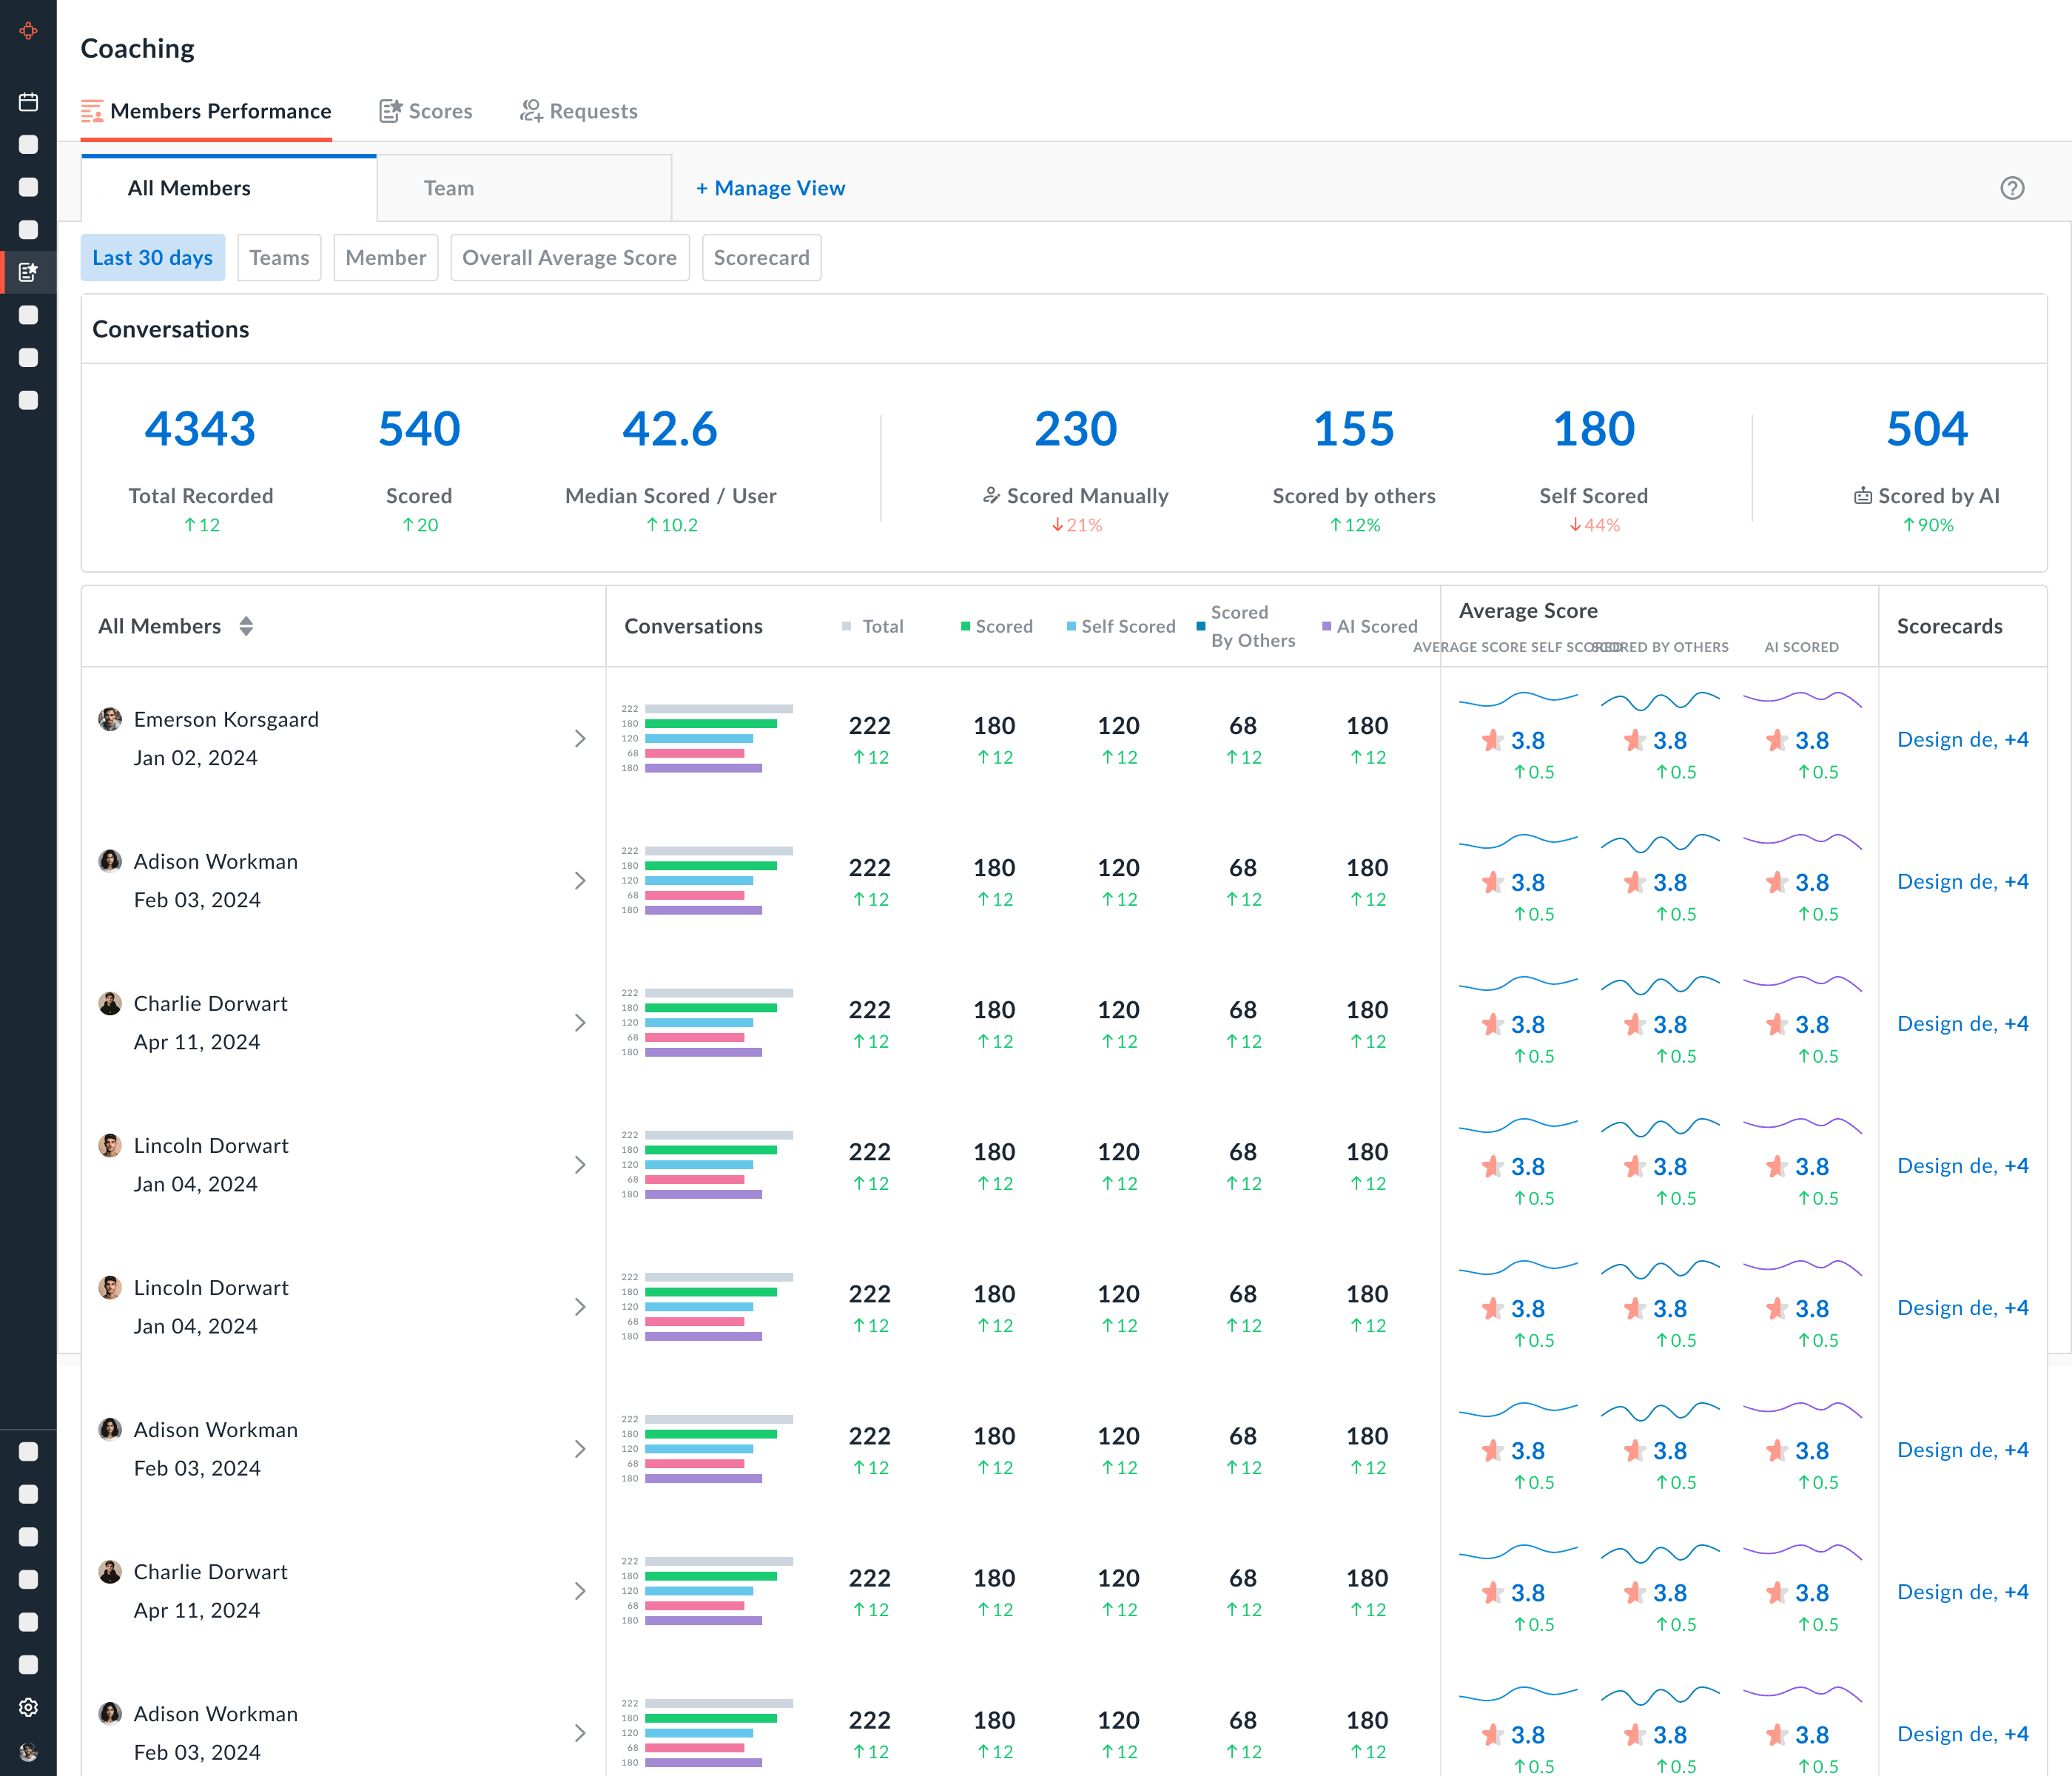
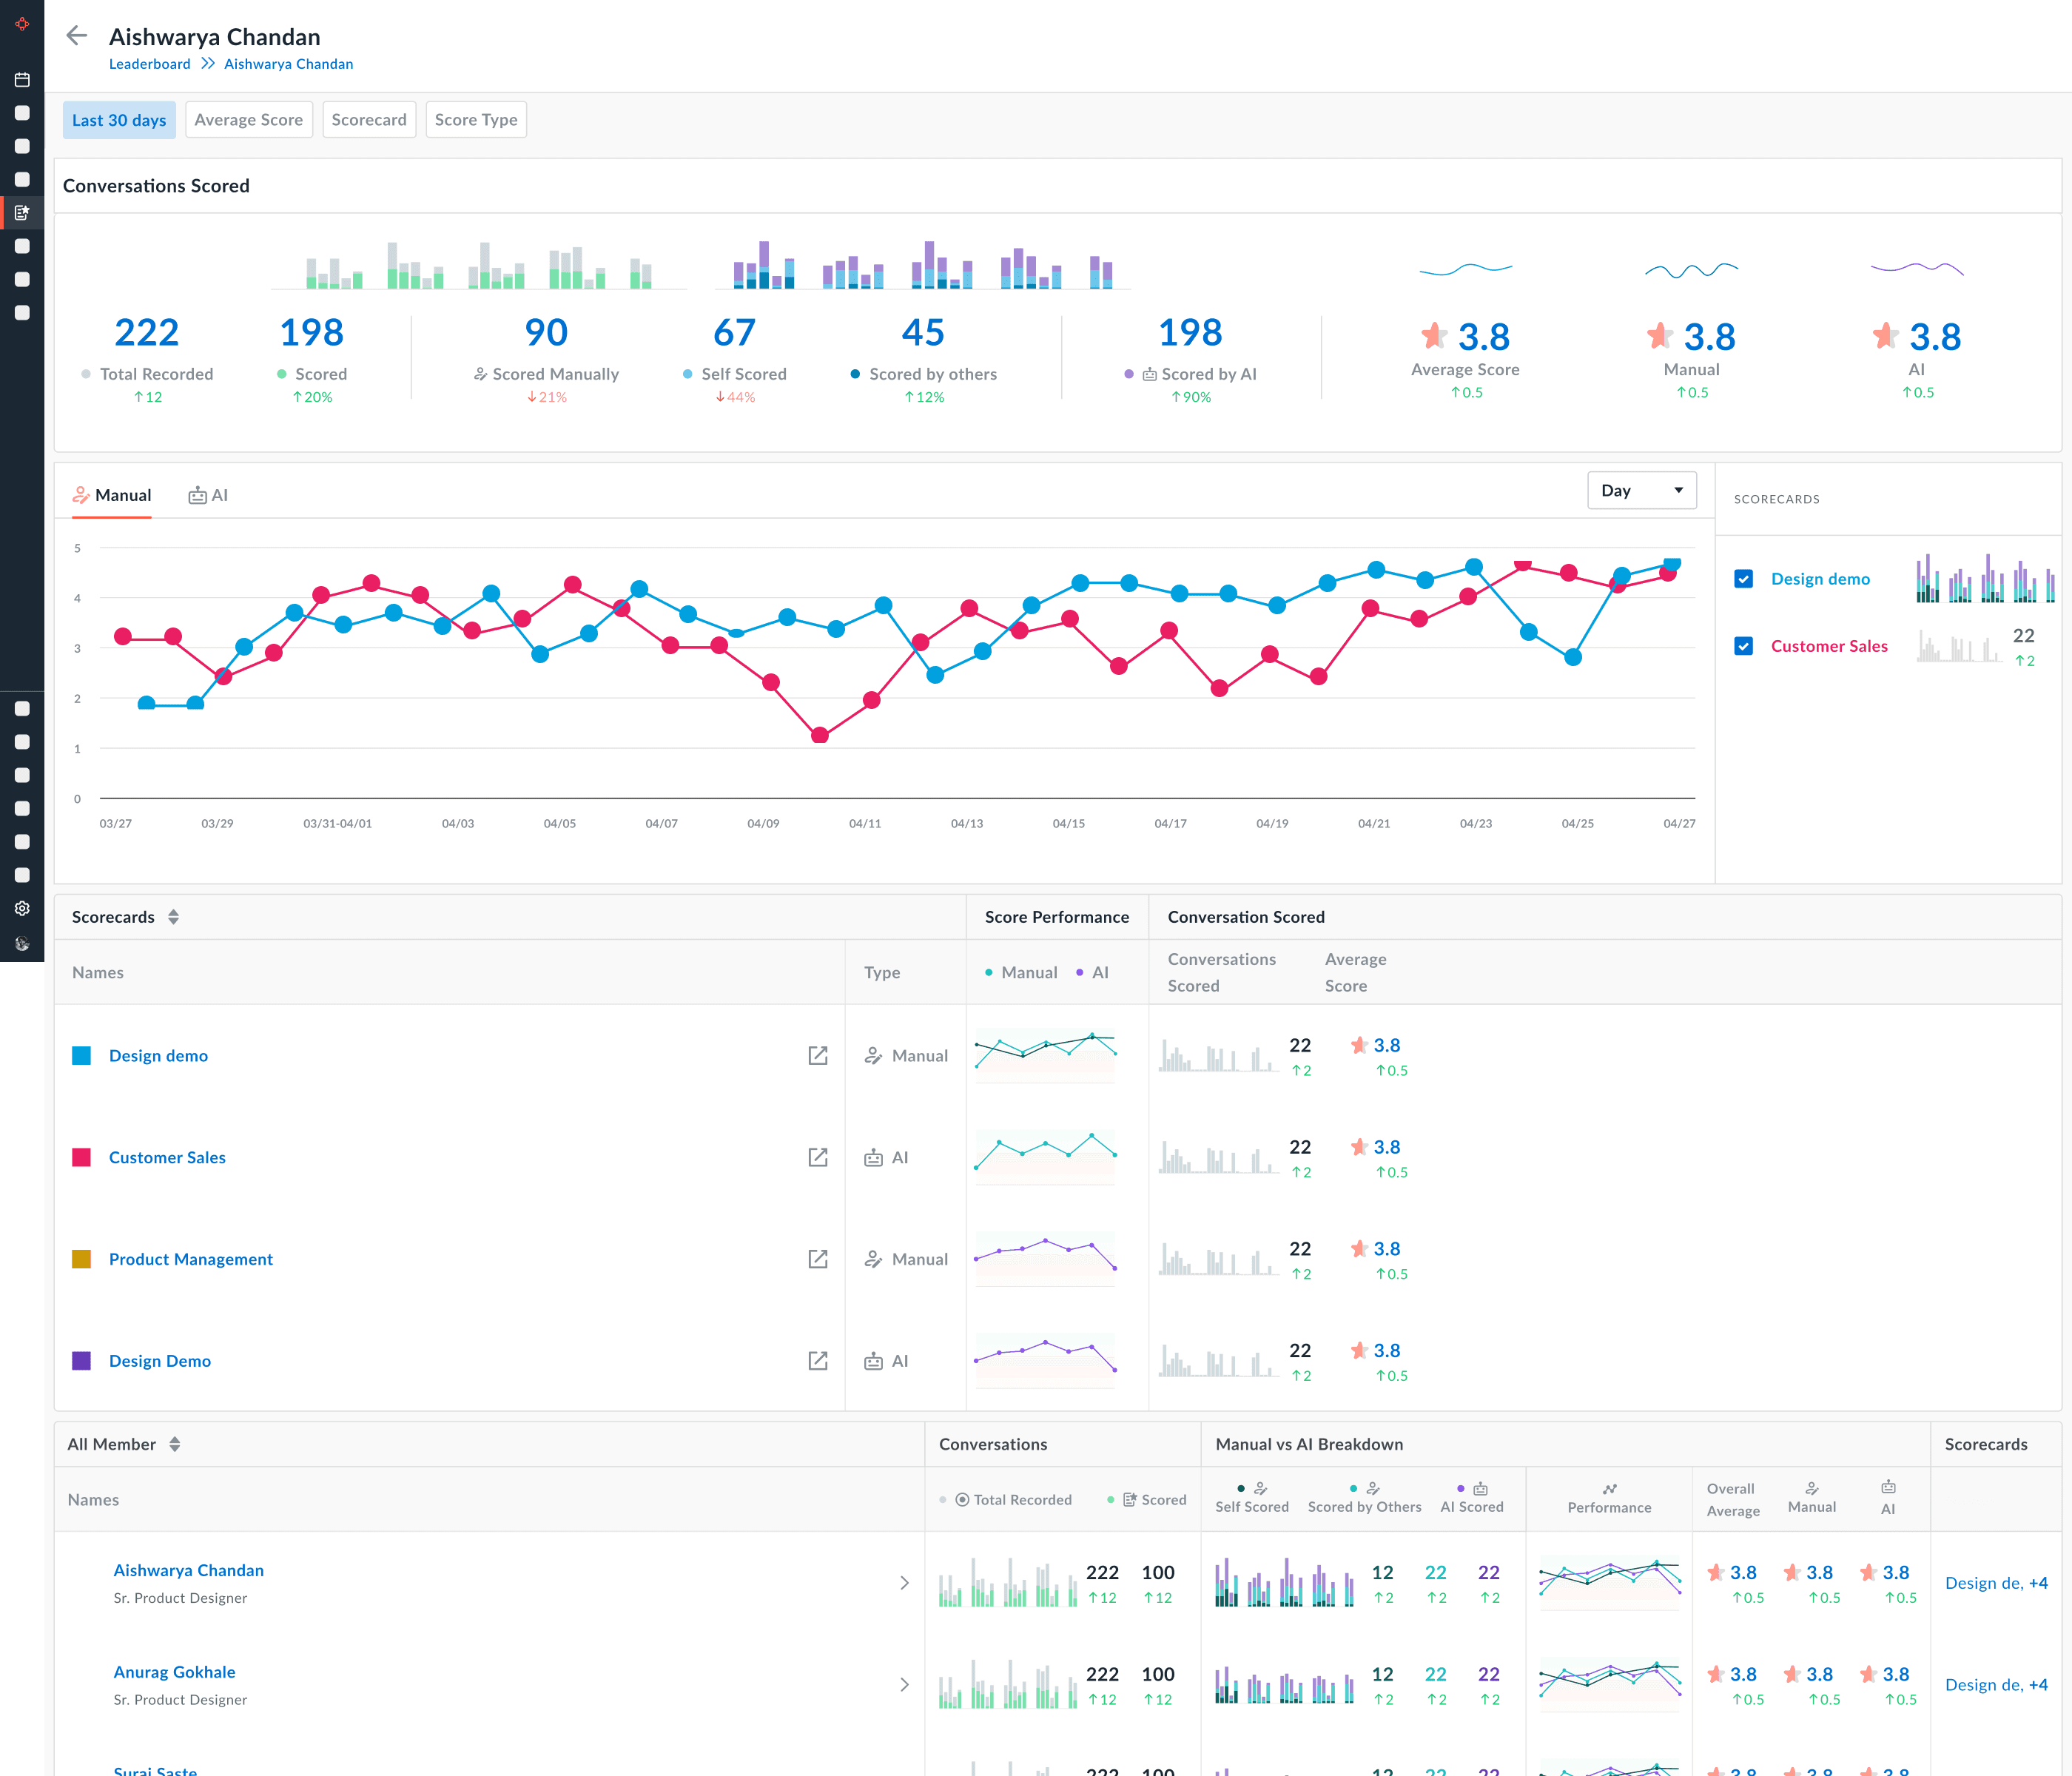
Final Version
"Members Performance"
Final Architecture

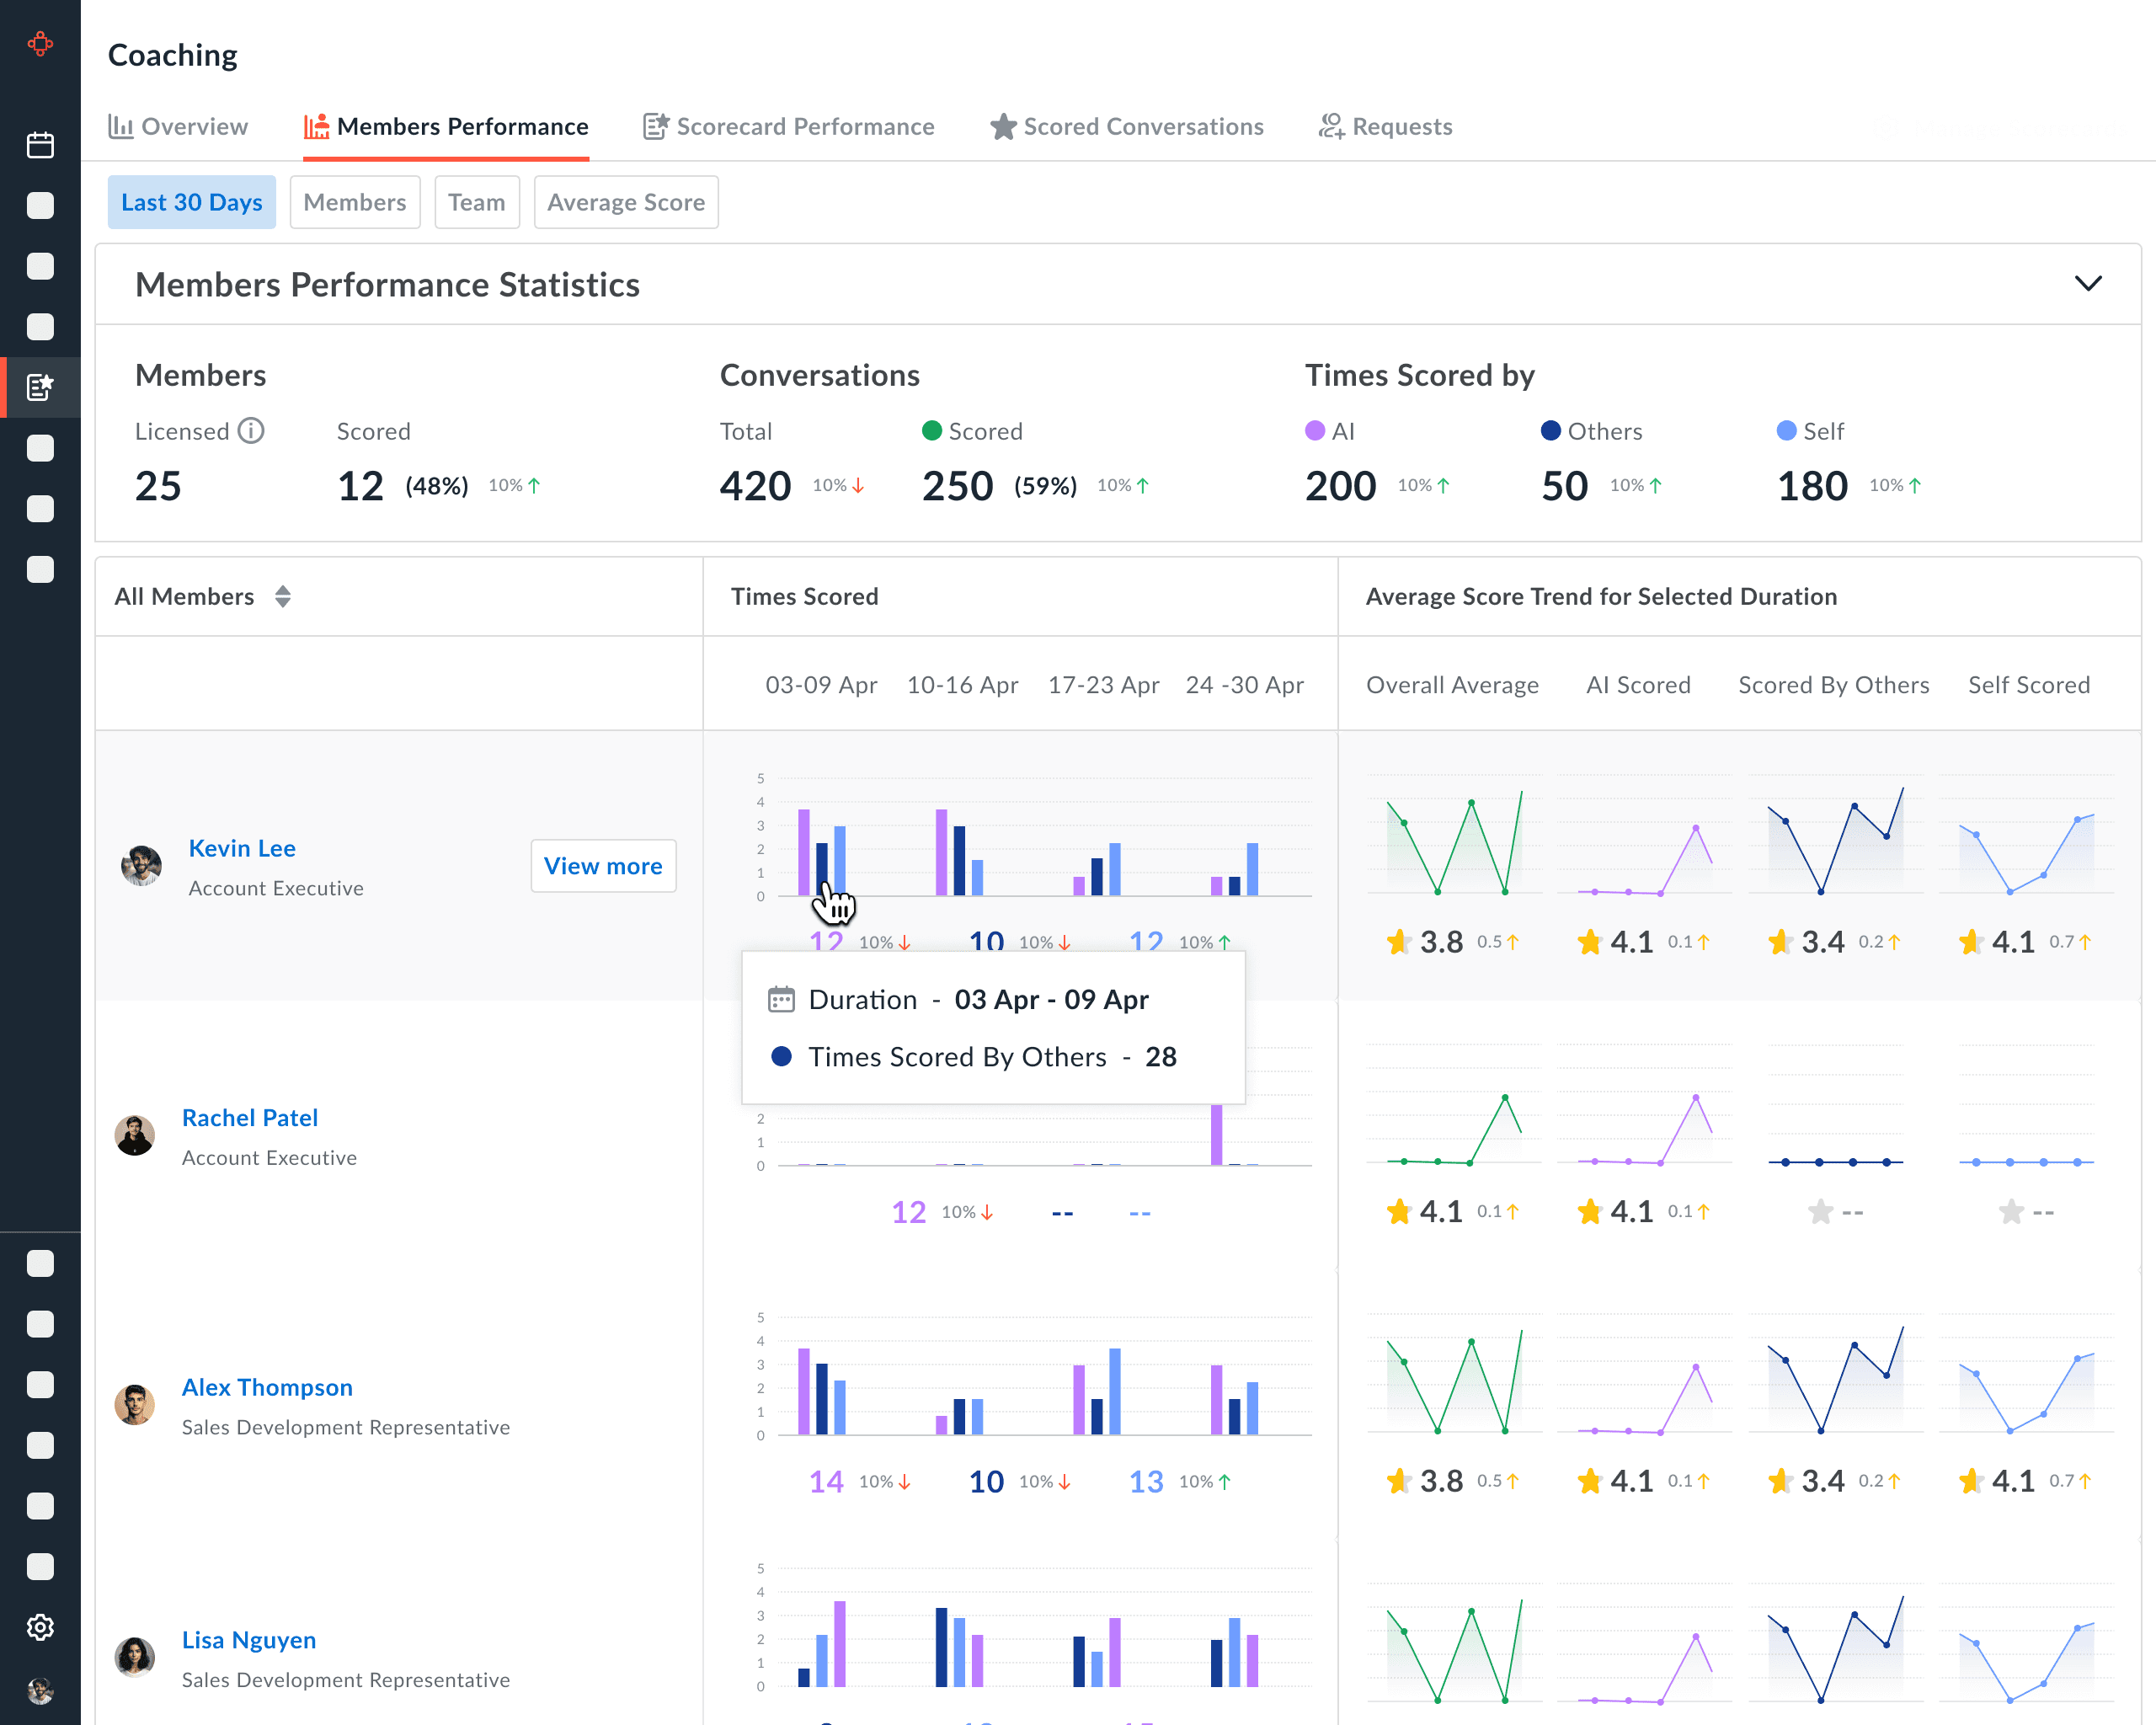

Final Version
"Members Performance"
Final Architecture
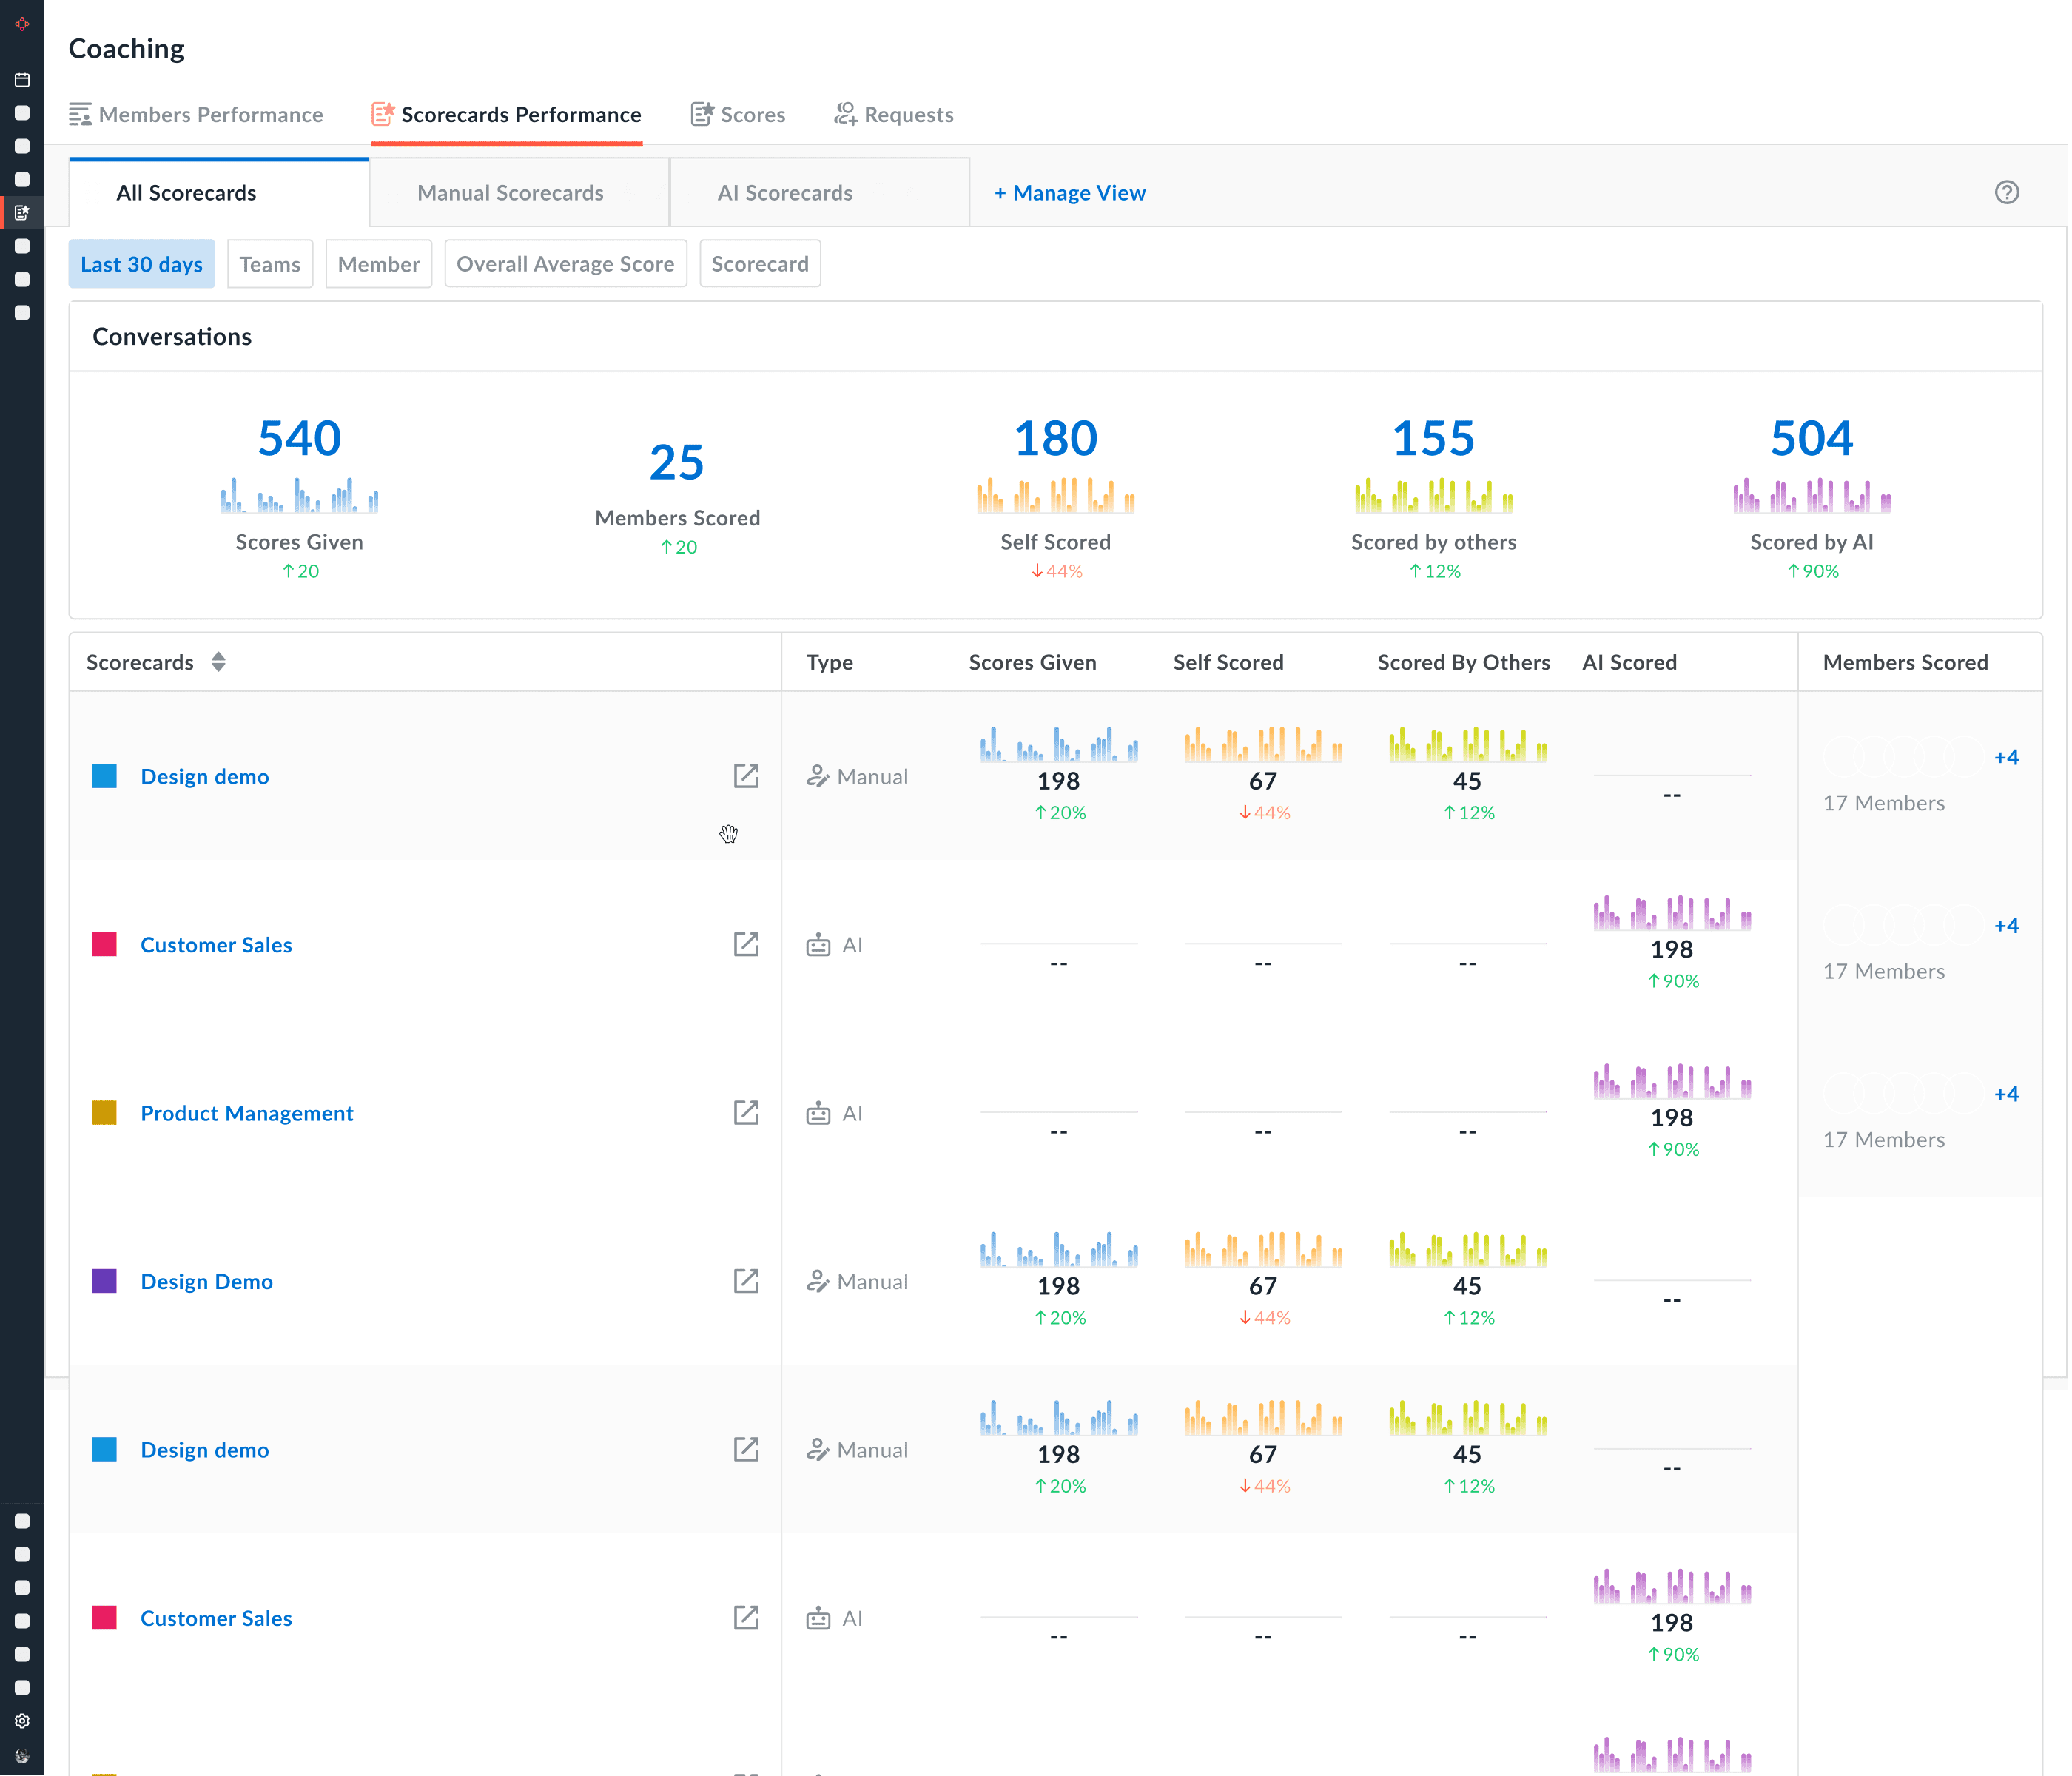
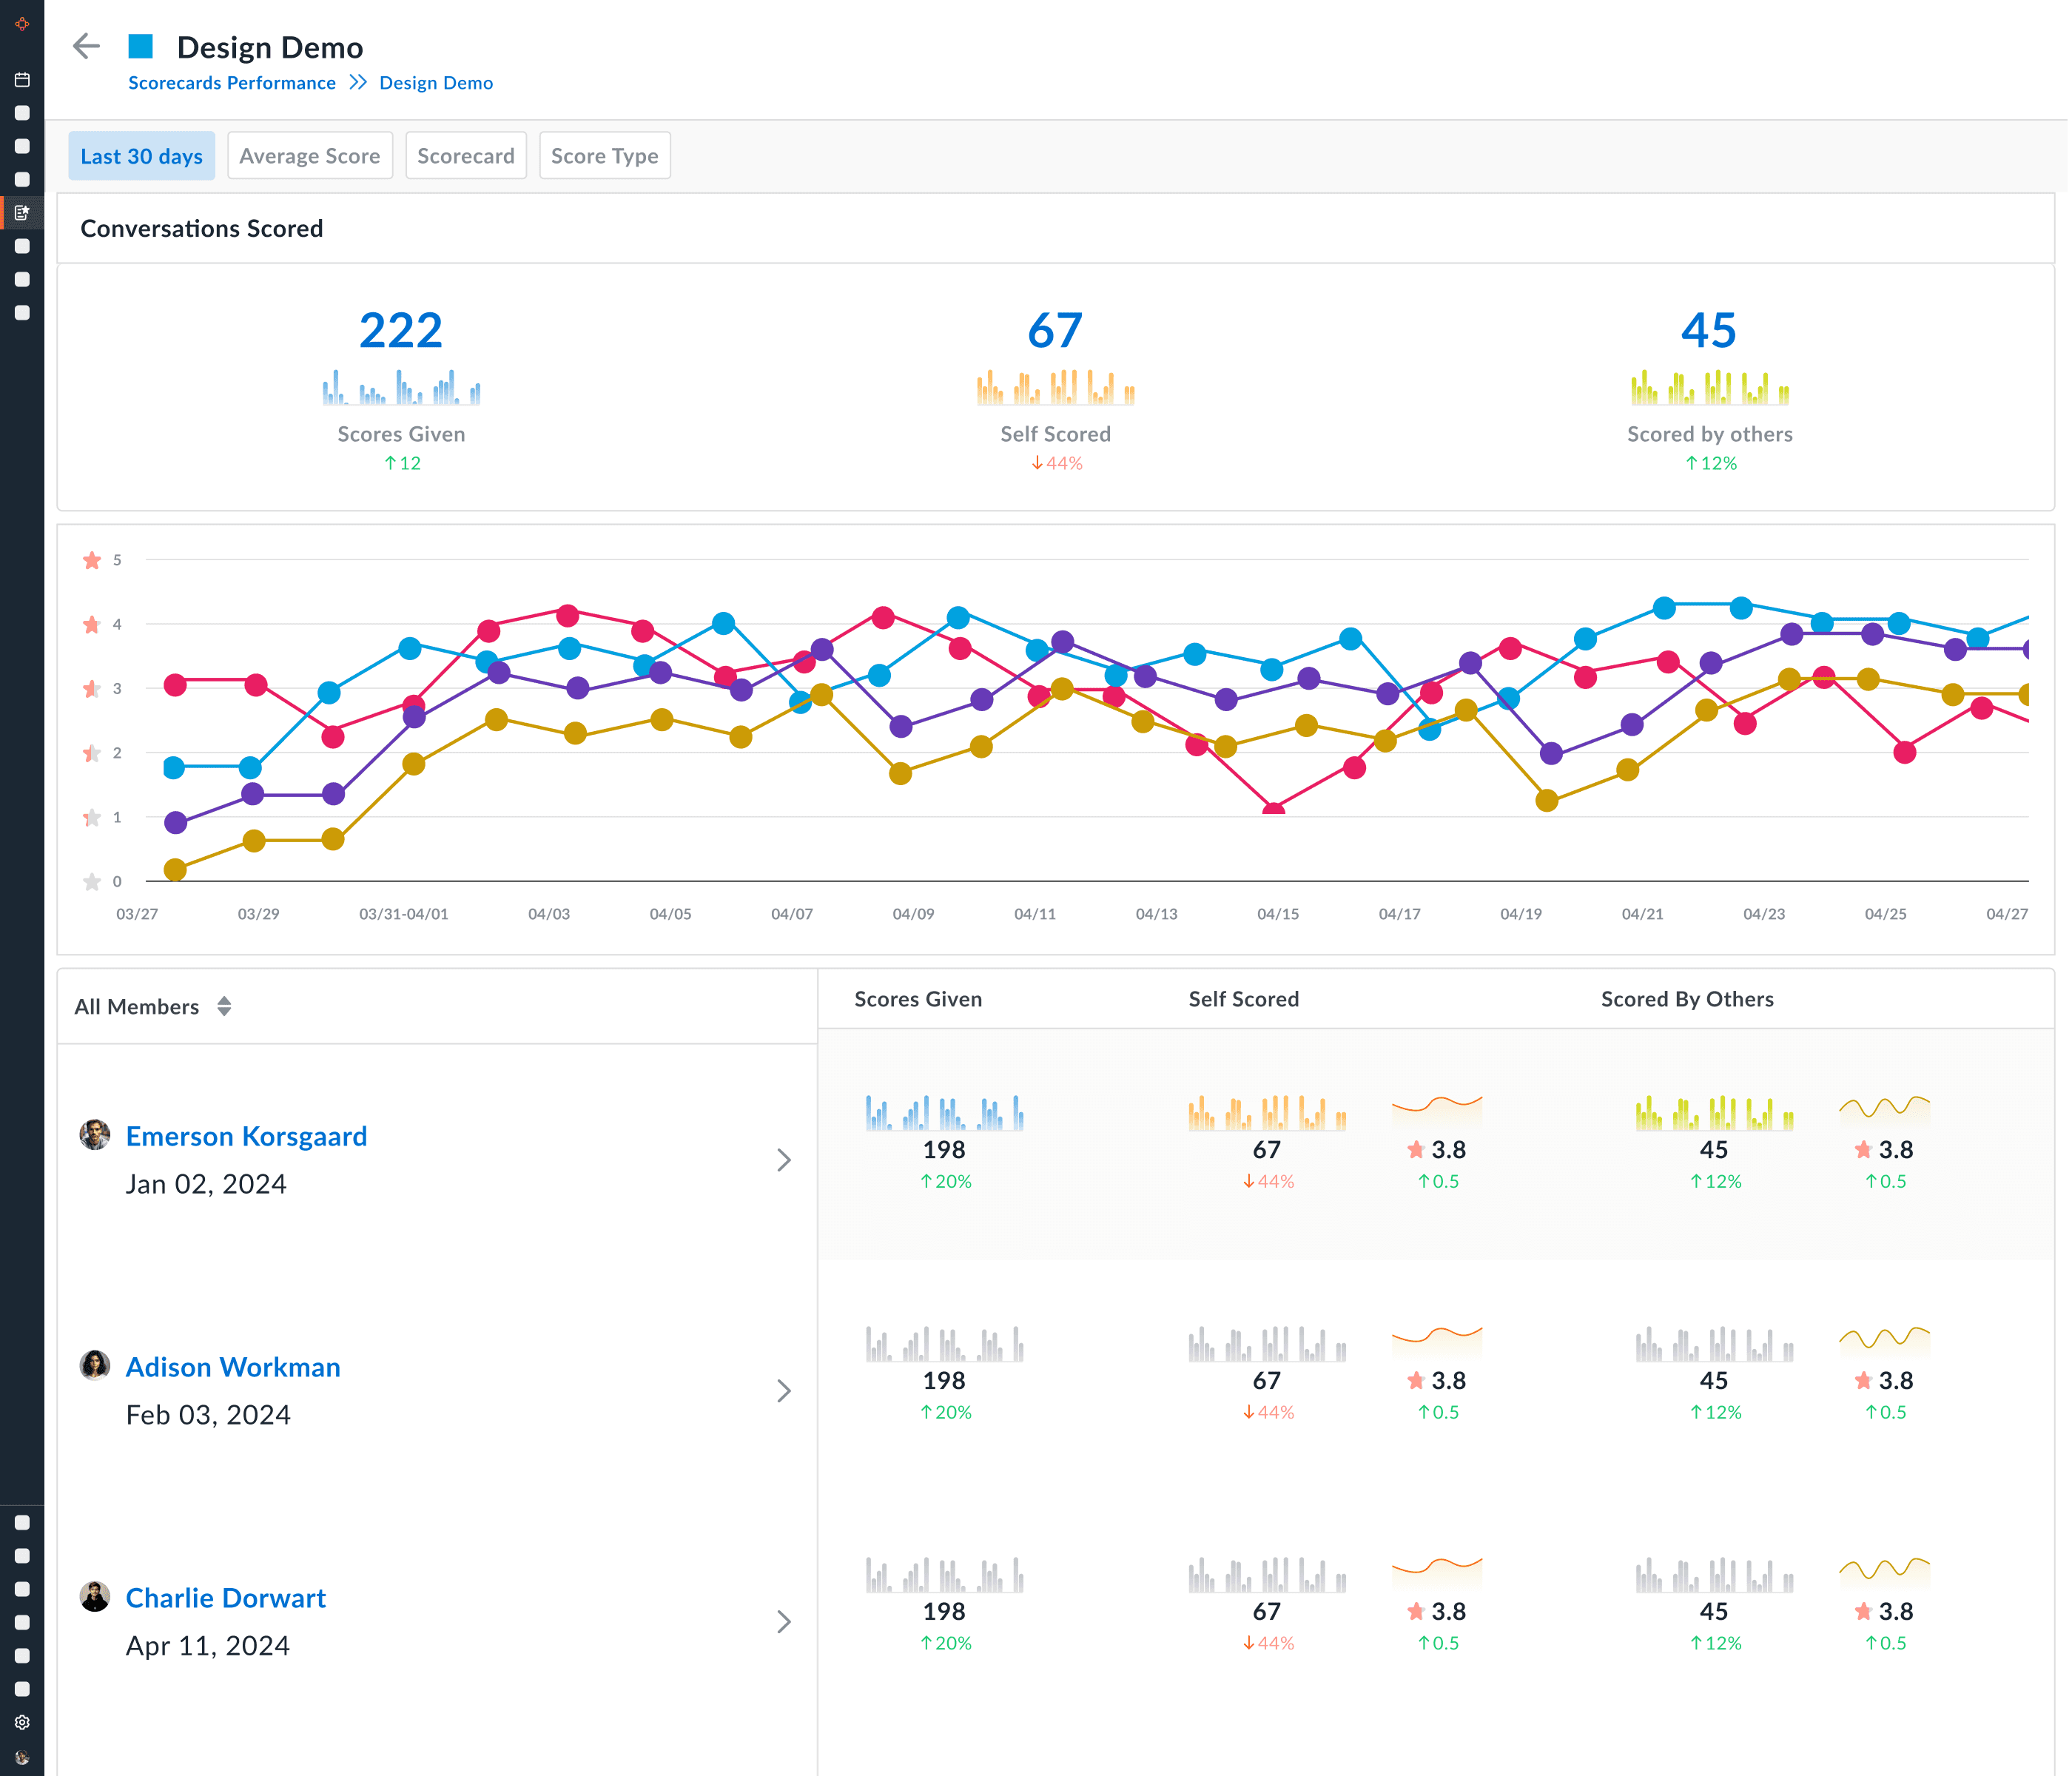
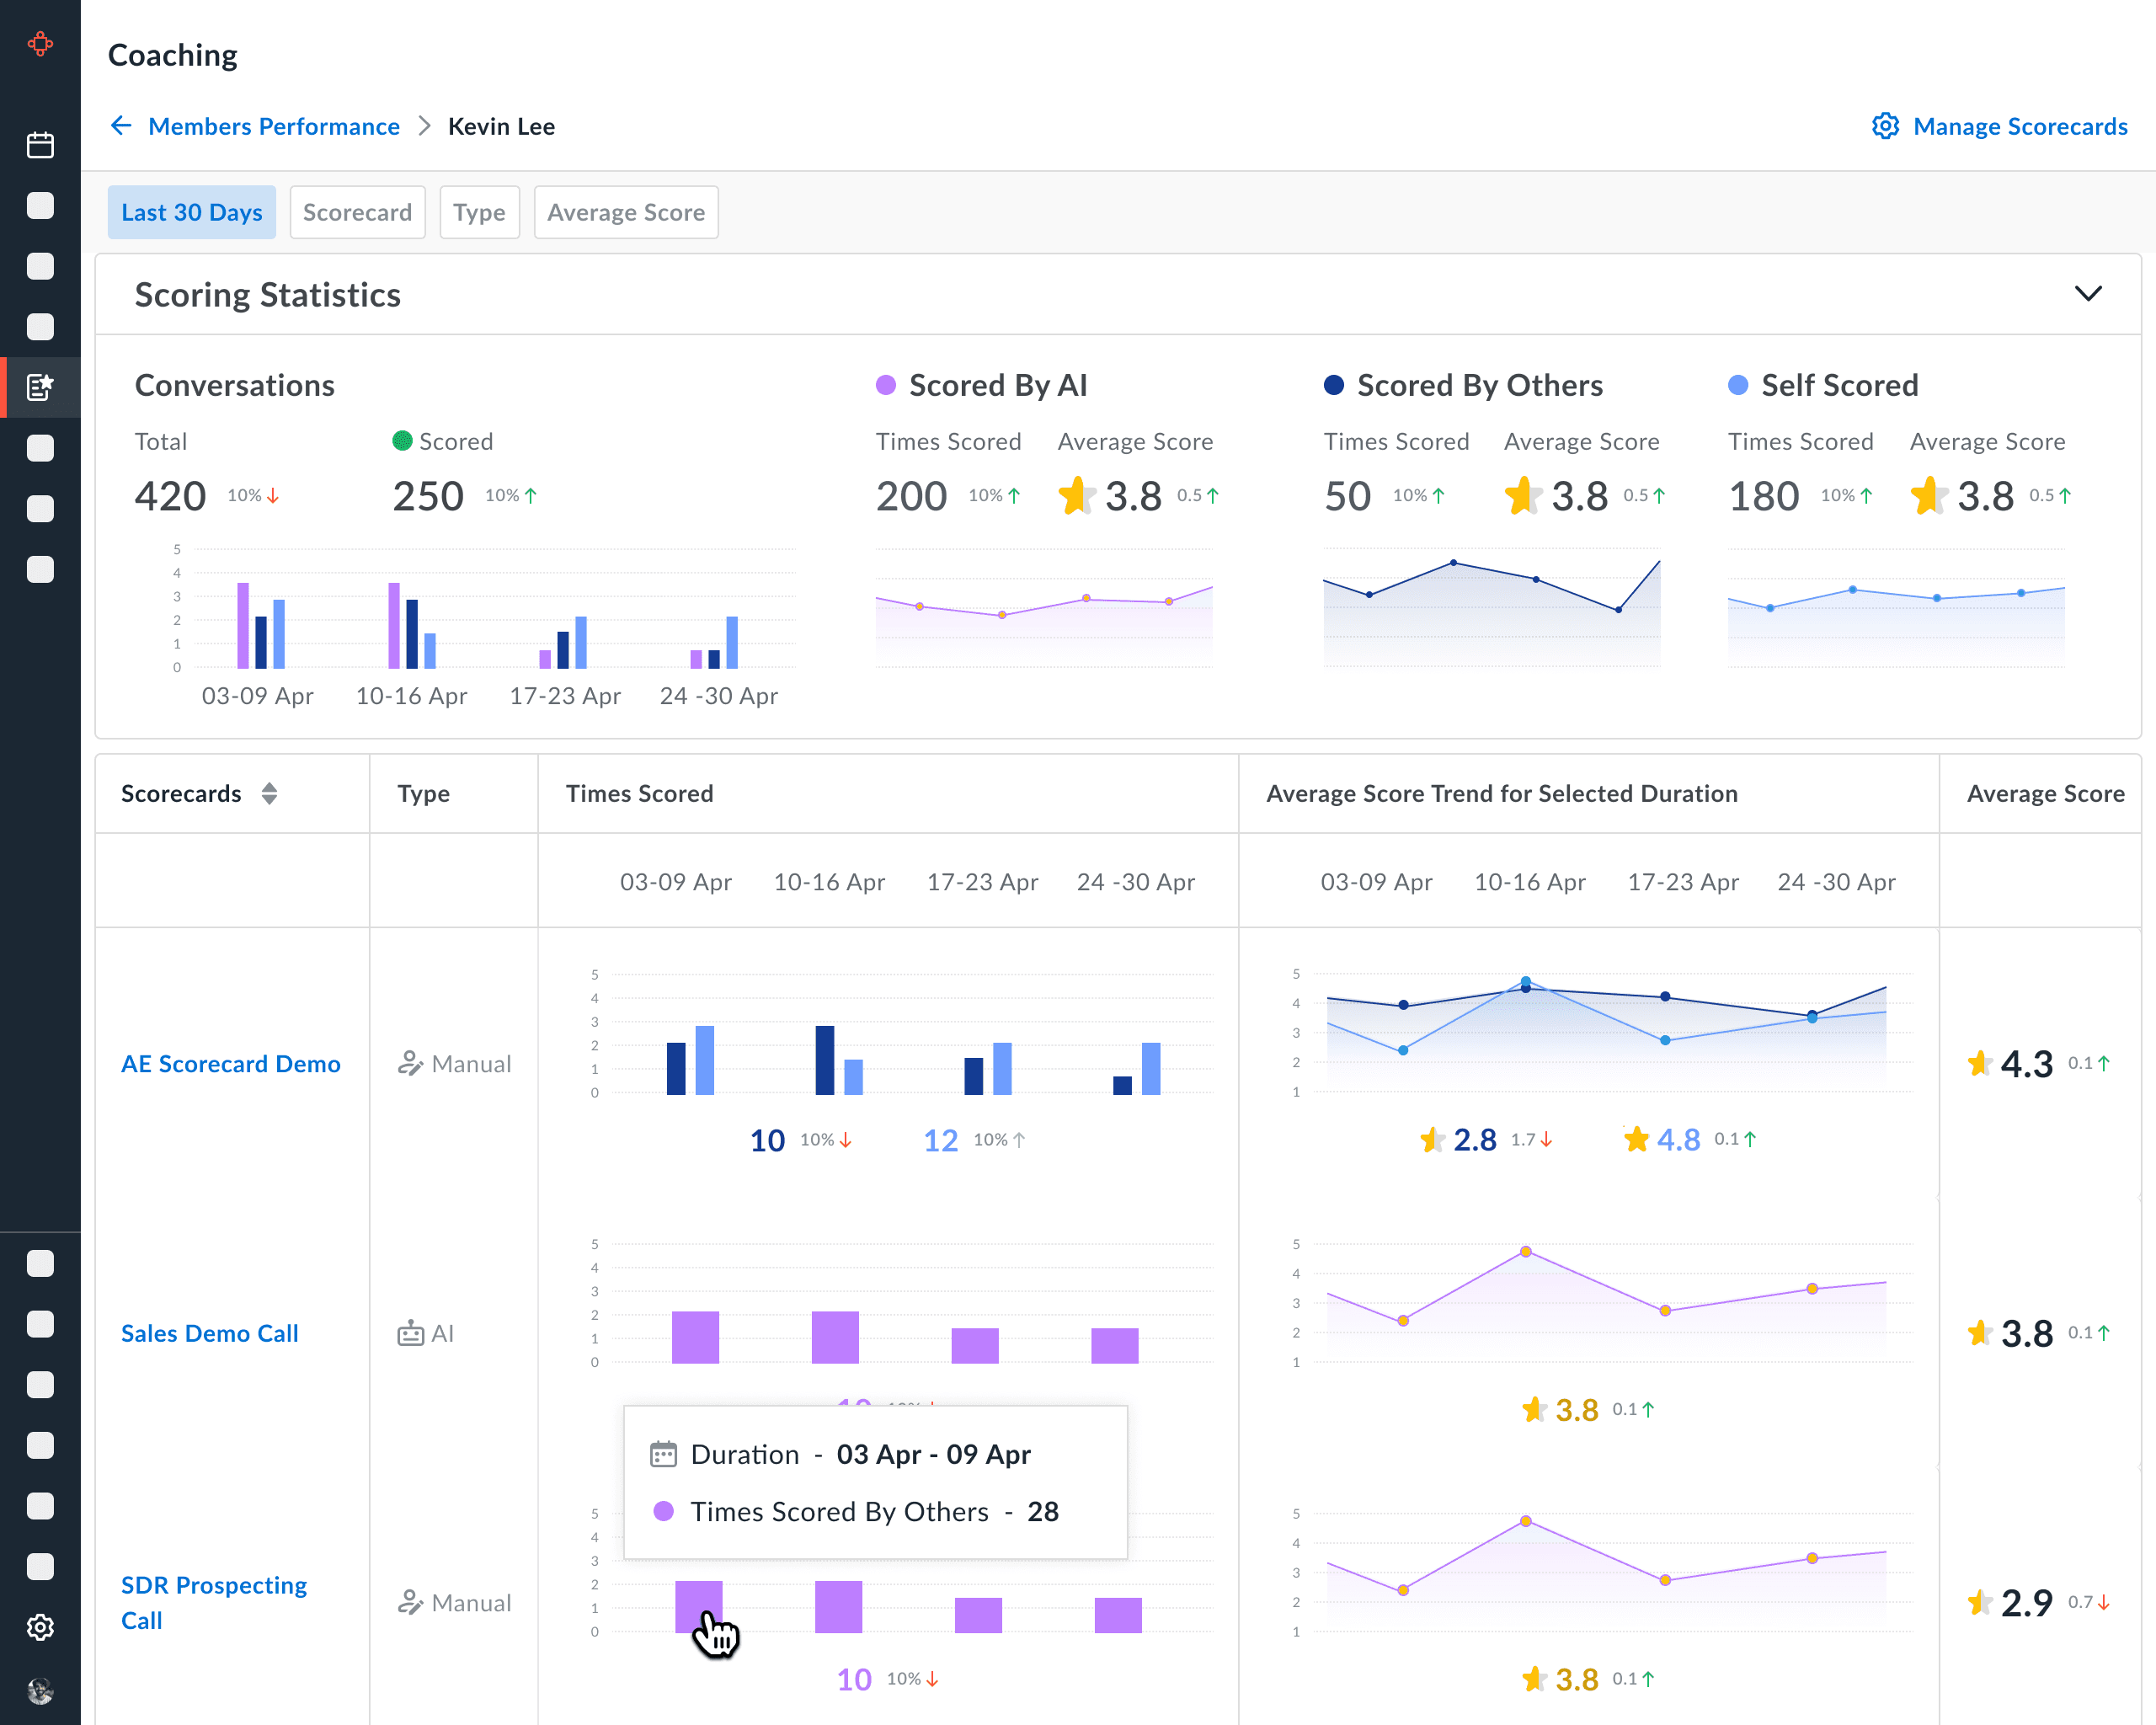
Final Version
"Scorecards Performance"
Final Architecture


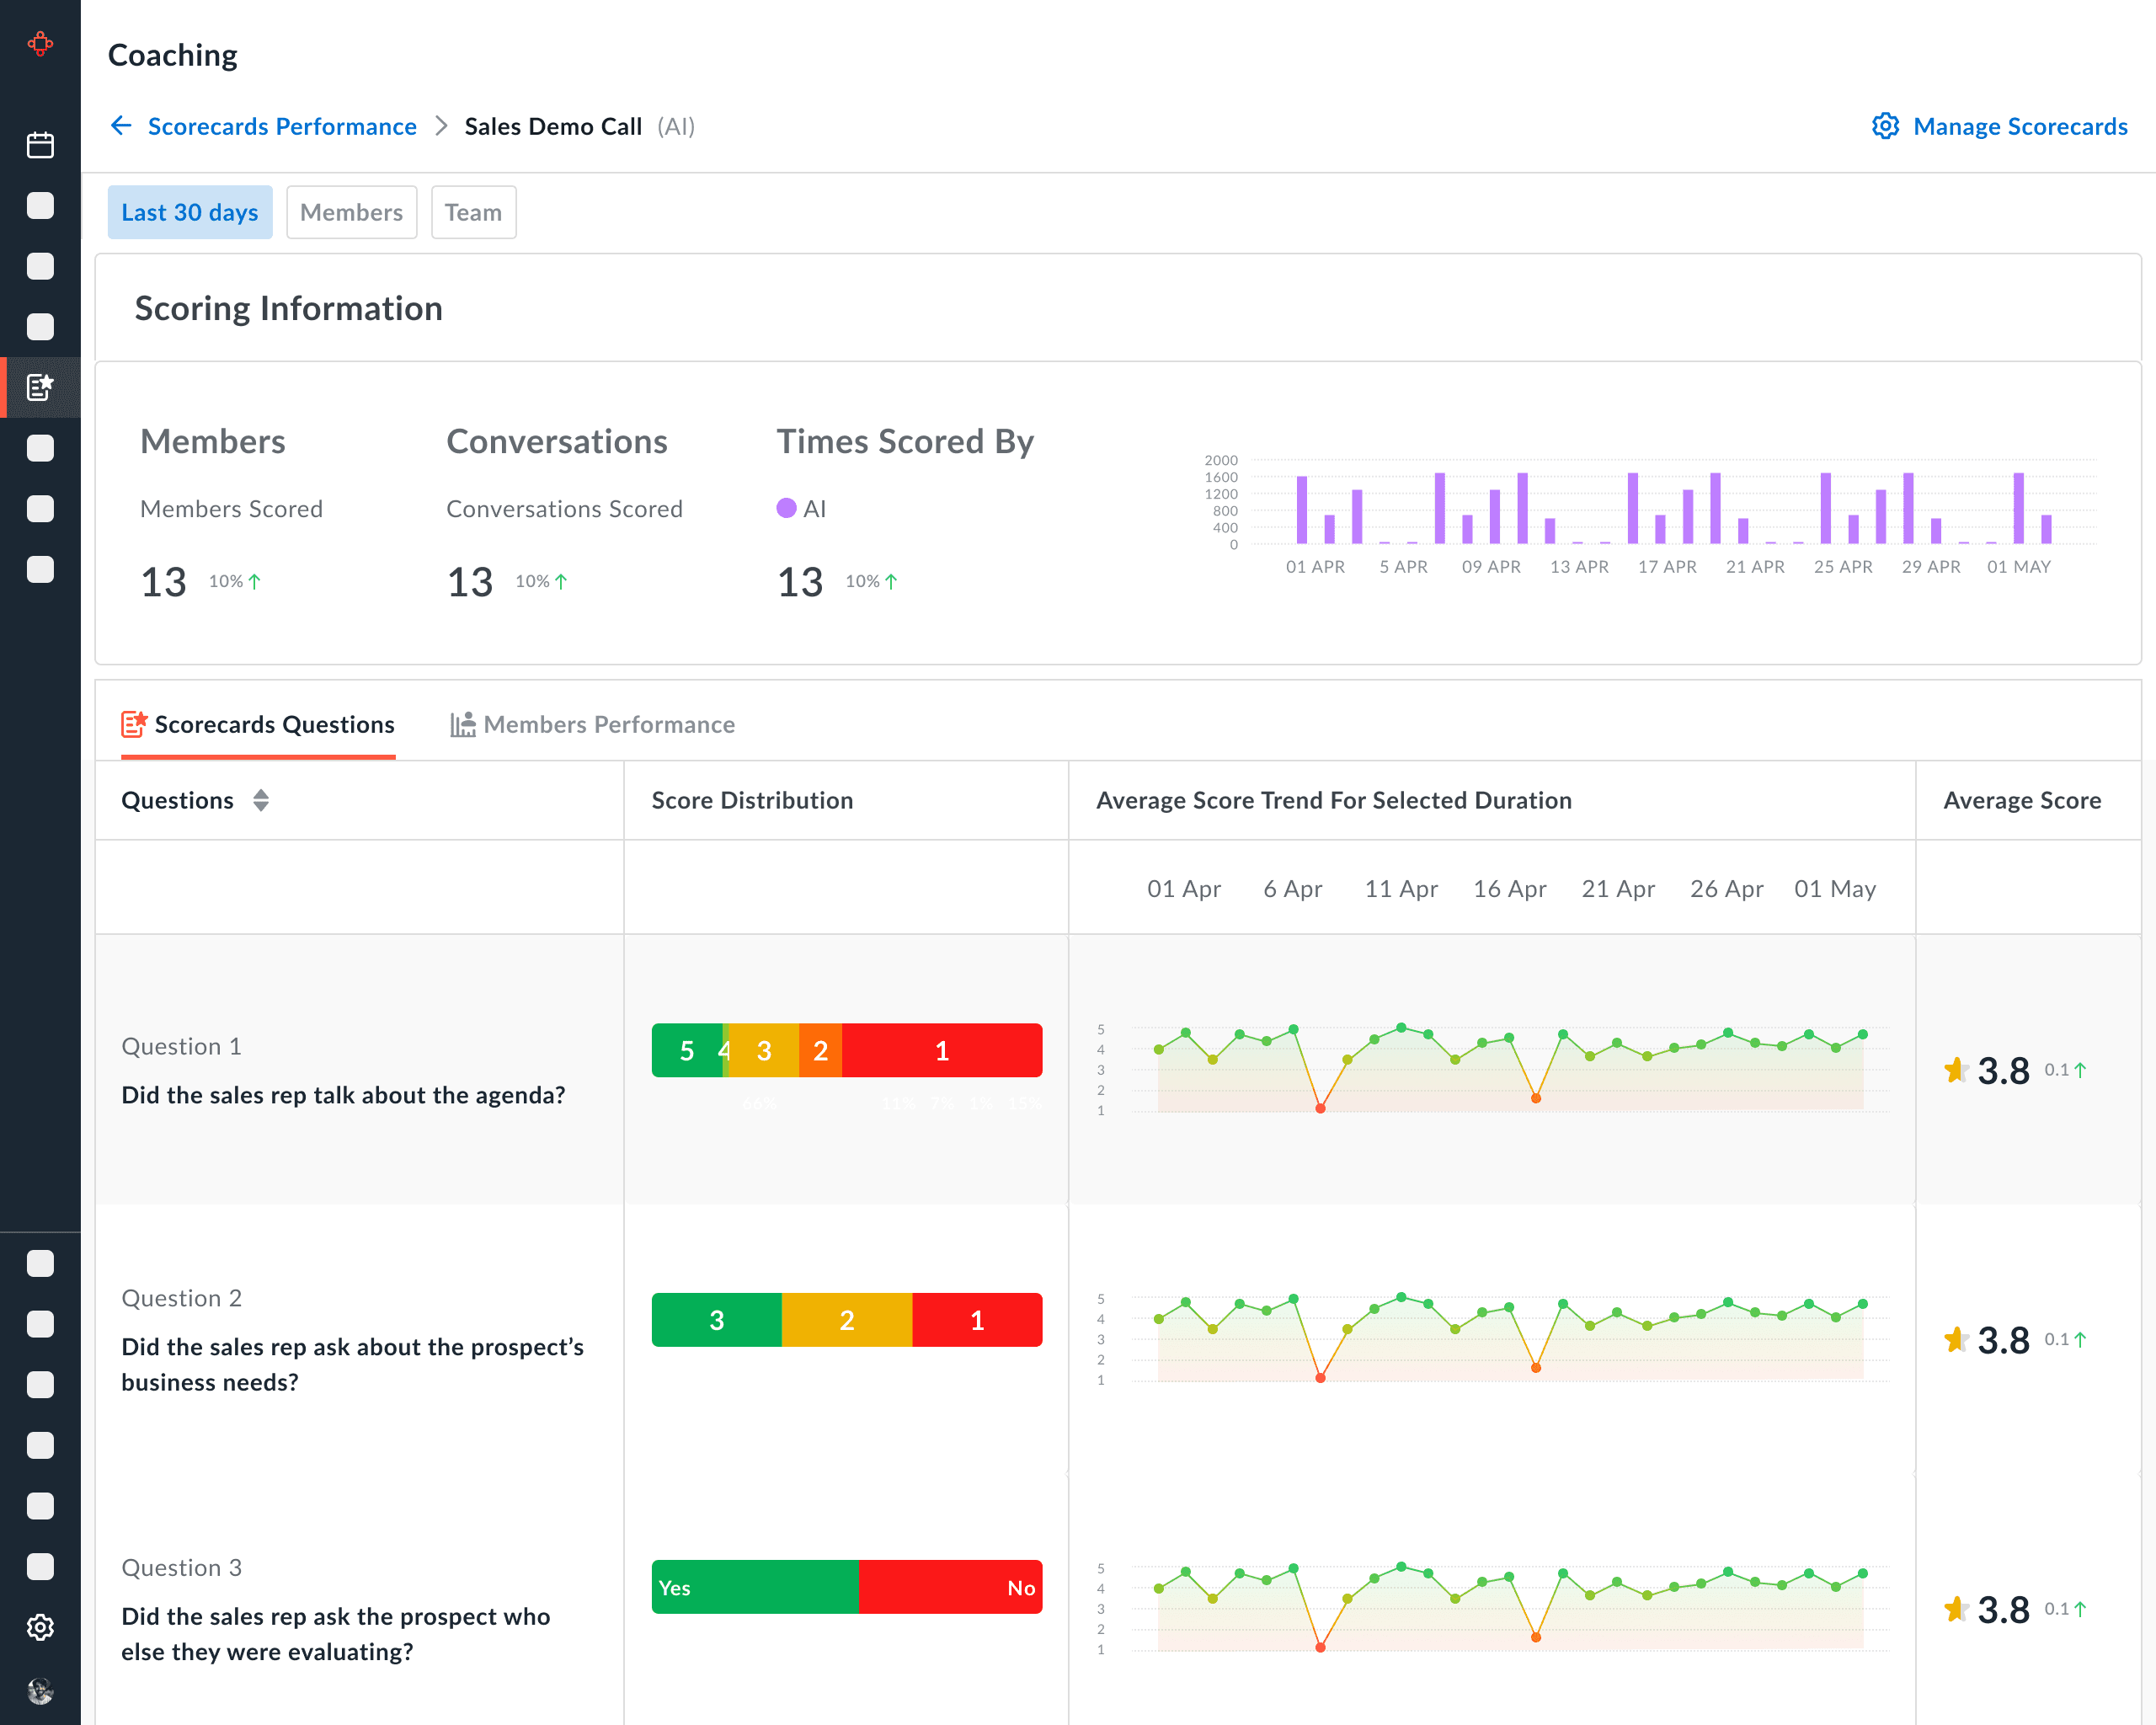
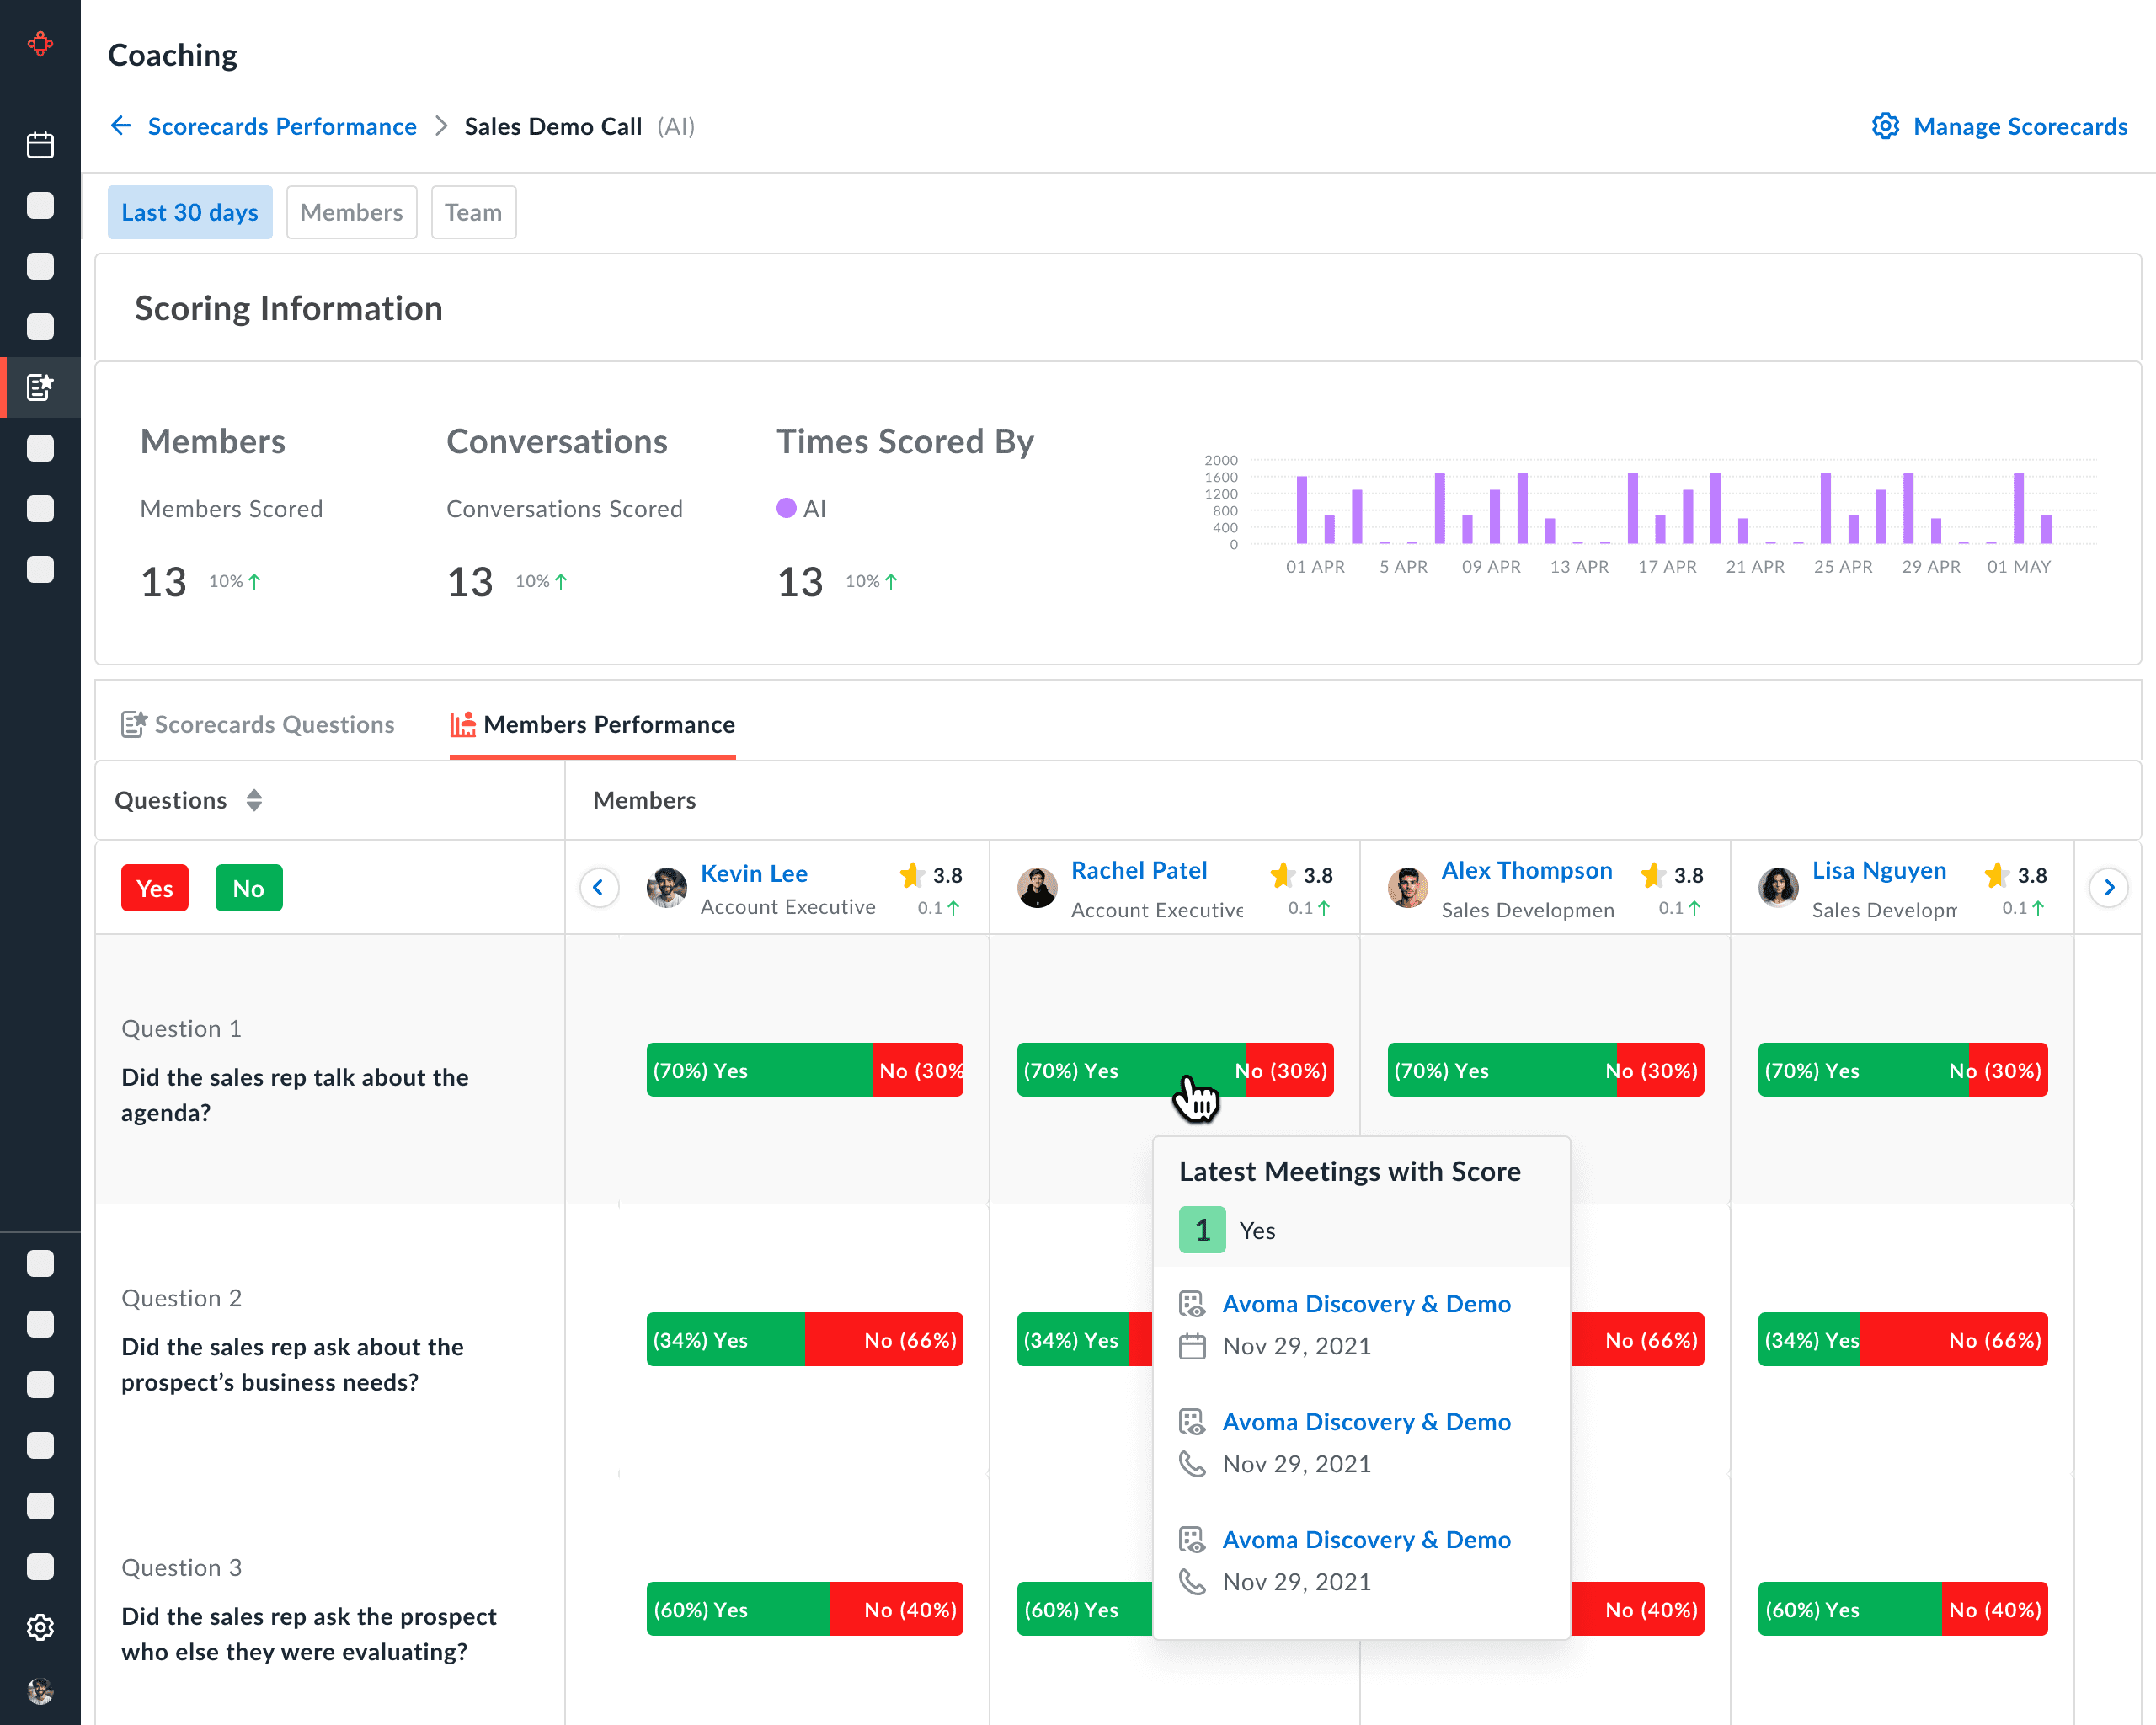
Final Version
"Scorecards Performance"
Final Architecture


Customer Feedback
Customer Feedback

Key Observations
Key Observations
Relevant Links

Thank You!
Relevant Links
Thank You!
Avoma AI Coaching Assistant
Avoma AI Coaching Assistant


Navigation
Case studies
© 2025 Aishwarya Chandan
Navigation
Case studies
© 2025 Aishwarya Chandan
Navigation
Case studies
© 2025 Aishwarya Chandan