Granular insights with - Coaching Dashboards
Performance Reports —> Actionable Coaching
Role: Product Designer
Company: Avoma
Scope: End-to-end design (research, UX, iterations with PM, AI & Engineering)

Granular insights with - Coaching Dashboards
Performance Reports —> Actionable Coaching
Role: Product Designer
Company: Avoma
Scope: End-to-end design (research, UX, iterations with PM, AI & Engineering)
Problem Statement
Sales managers were using scorecards to review call quality, but the experience behaved like a reporting tool, not a coaching system.
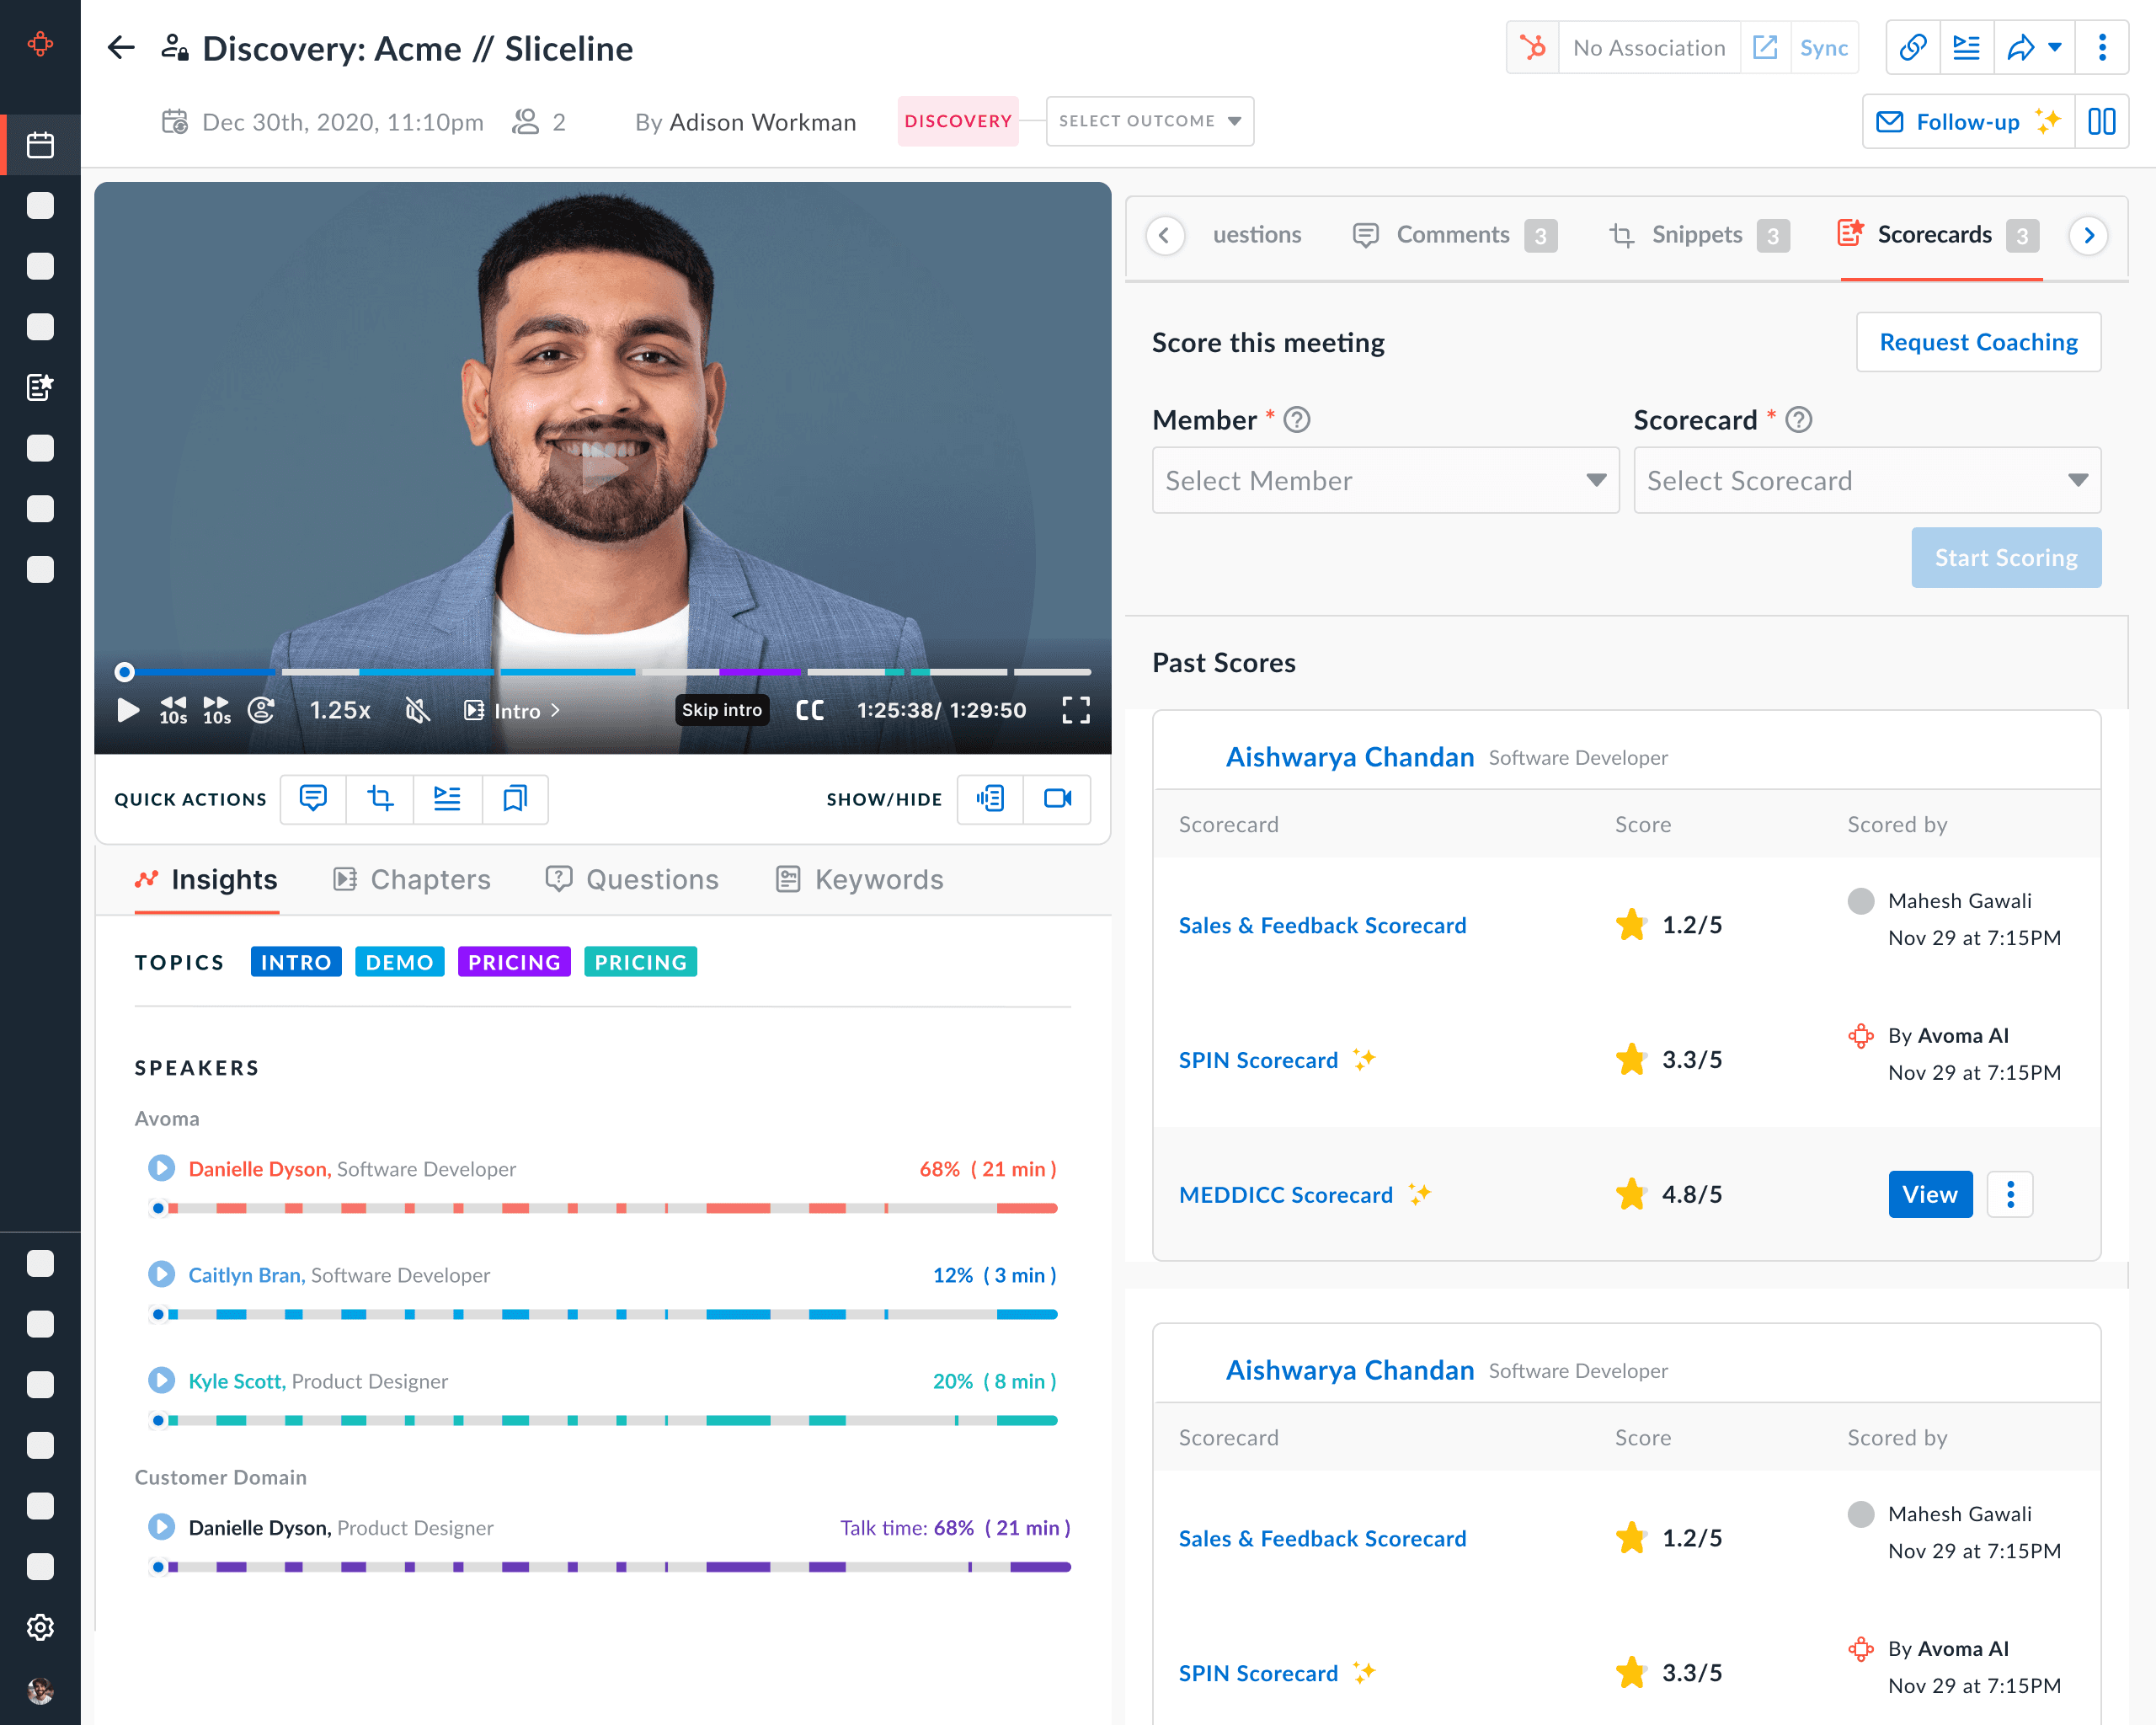
Problem Statement
Sales managers were using scorecards to review call quality, but the experience behaved like a reporting tool, not a coaching system.
What Was the Exact User Pain?
“I don’t have time to listen to every call.”
“I don’t know which rep needs what kind of coaching.”
“I can’t prove coaching is improving performance.”
Managers were overwhelmed and operating on instinct.

Sales Managers Pain

Reps felt evaluated — not developed.
Sales Rep Pain
“I don’t know what ‘good’ looks like.”
“I get feedback but no measurable progress.”
“How do I improve systematically?”
What Was the Exact User Pain?
“I don’t have time to listen to every call.”
“I don’t know which rep needs what kind of coaching.”
“I can’t prove coaching is improving performance.”
Managers were overwhelmed and operating on instinct.
Sales Managers Pain
Reps felt evaluated — not developed.
Sales Rep Pain
“I don’t know what ‘good’ looks like.”
“I get feedback but no measurable progress.”
“How do I improve systematically?”
What Was Broken Before?
Fragmented Coaching

Coaching was reactive, not systematic.
Earlier managers reviewed call recordings manually
Feedback was subjective
Coaching notes lived in Comments
No centralized behavioral tracking
Revenue was visible. Behavior was invisible.
Managers could see revenue numbers, activity metrics (calls made, meetings booked)
But they could NOT see "which conversational behaviors influenced outcomes"
No Behavior-to-Feedback
As teams scaled:
Managers couldn’t review enough calls
Feedback frequency dropped
New reps ramped slowly
Coaching didn’t scale with team growth.
No Scalable Feedback
What Was Broken Before?
Fragmented Coaching
Coaching was reactive, not systematic.
Earlier managers reviewed call recordings manually
Feedback was subjective
Coaching notes lived in Comments
No centralized behavioral tracking
Revenue was visible. Behavior was invisible.
Managers could see revenue numbers, activity metrics (calls made, meetings booked)
But they could NOT see "which conversational behaviors influenced outcomes"
No Behavior-to-Feedback
As teams scaled:
Managers couldn’t review enough calls
Feedback frequency dropped
New reps ramped slowly
Coaching didn’t scale with team growth.
No Scalable Feedback
What Was the Cost of That?
"If coaching takes 30-60 mins per call review and a manager reviews 10 reps weekly, that’s hours lost to unstructured work."
Slower rep ramp time
Manager time spent reviewing calls manually
Lost deals due to conversational mistakes
Cost to Business

Unclear expectations
Feedback based on opinion, not data
No visibility into improvement trends
Reps didn’t know:
“Am I improving or just being judged?”
Cost to Reps
Avoma risked being seen as a transcription tool, not a revenue intelligence platform
AI insights were underutilized
Low feature adoption risk
Without dashboards, AI value wasn’t visible.
Cost to Product
What Was the Cost of That?
"If coaching takes 30-60 mins per call review and a manager reviews 10 reps weekly, that’s hours lost to unstructured work."
Slower rep ramp time
Manager time spent reviewing calls manually
Lost deals due to conversational mistakes
Cost to Business
Unclear expectations
Feedback based on opinion, not data
No visibility into improvement trends
Reps didn’t know:
“Am I improving or just being judged?”
Cost to Reps
Avoma risked being seen as a transcription tool, not a revenue intelligence platform
AI insights were underutilized
Low feature adoption risk
Without dashboards, AI value wasn’t visible.
Cost to Product
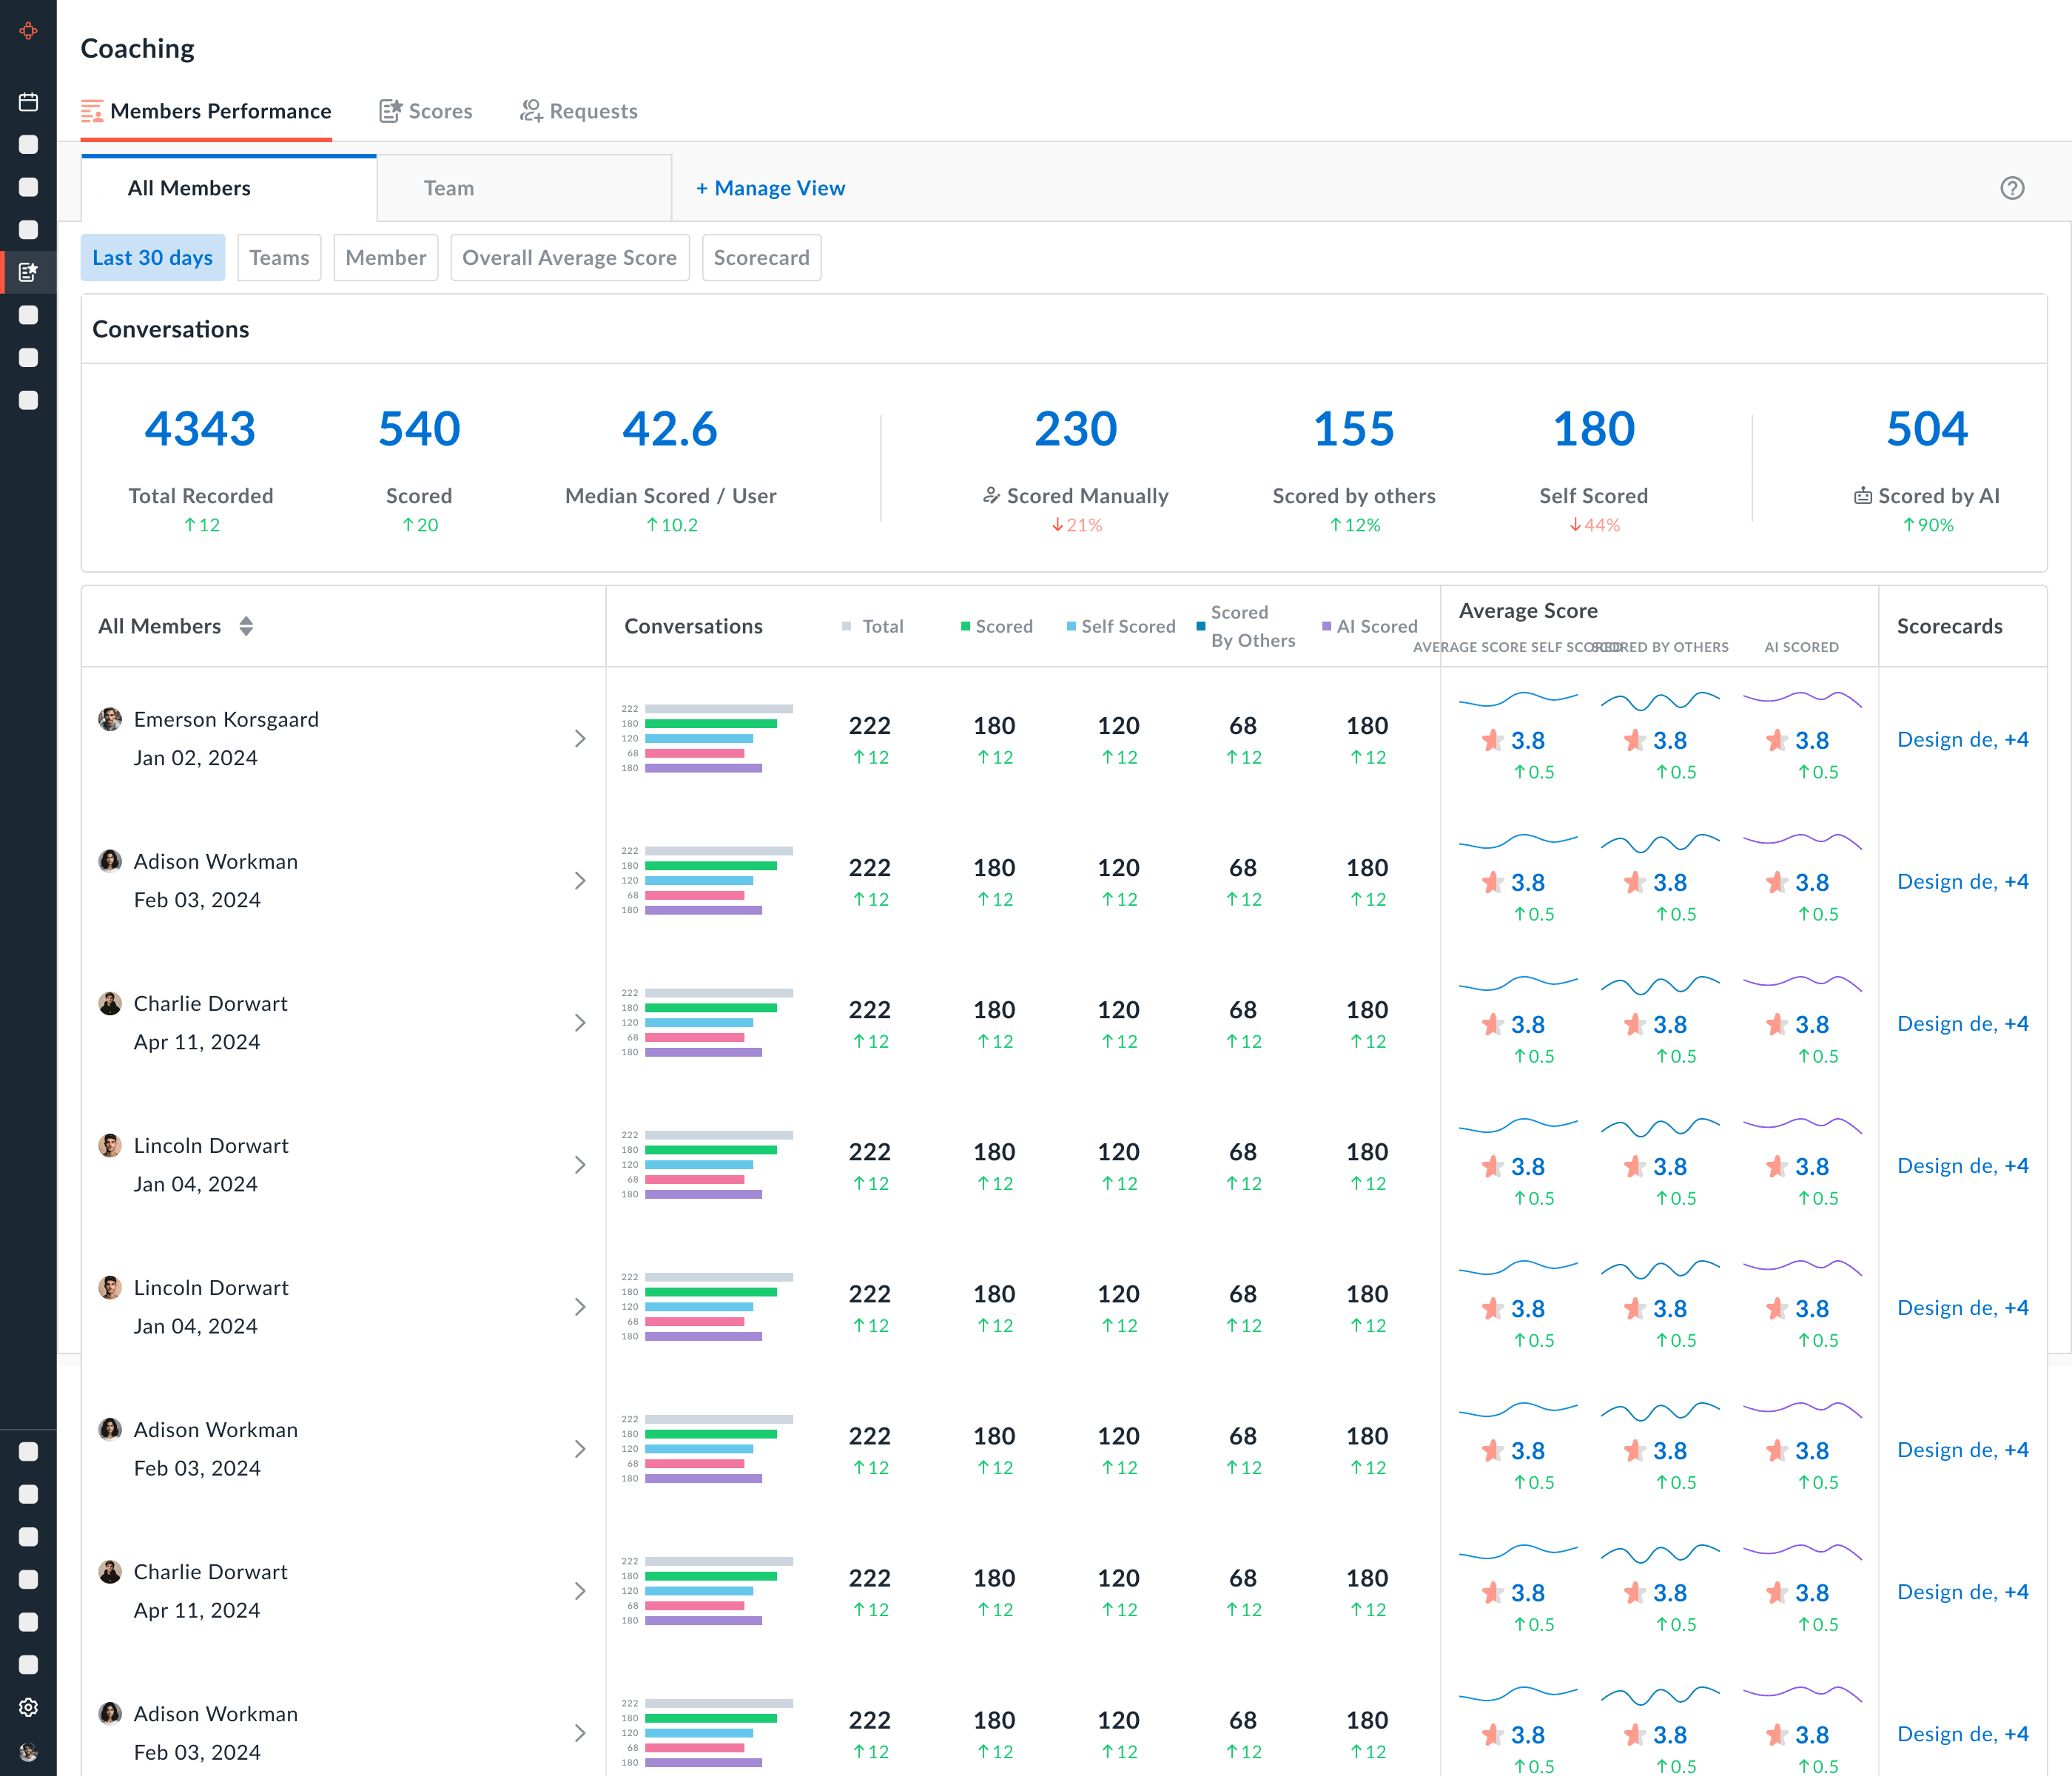
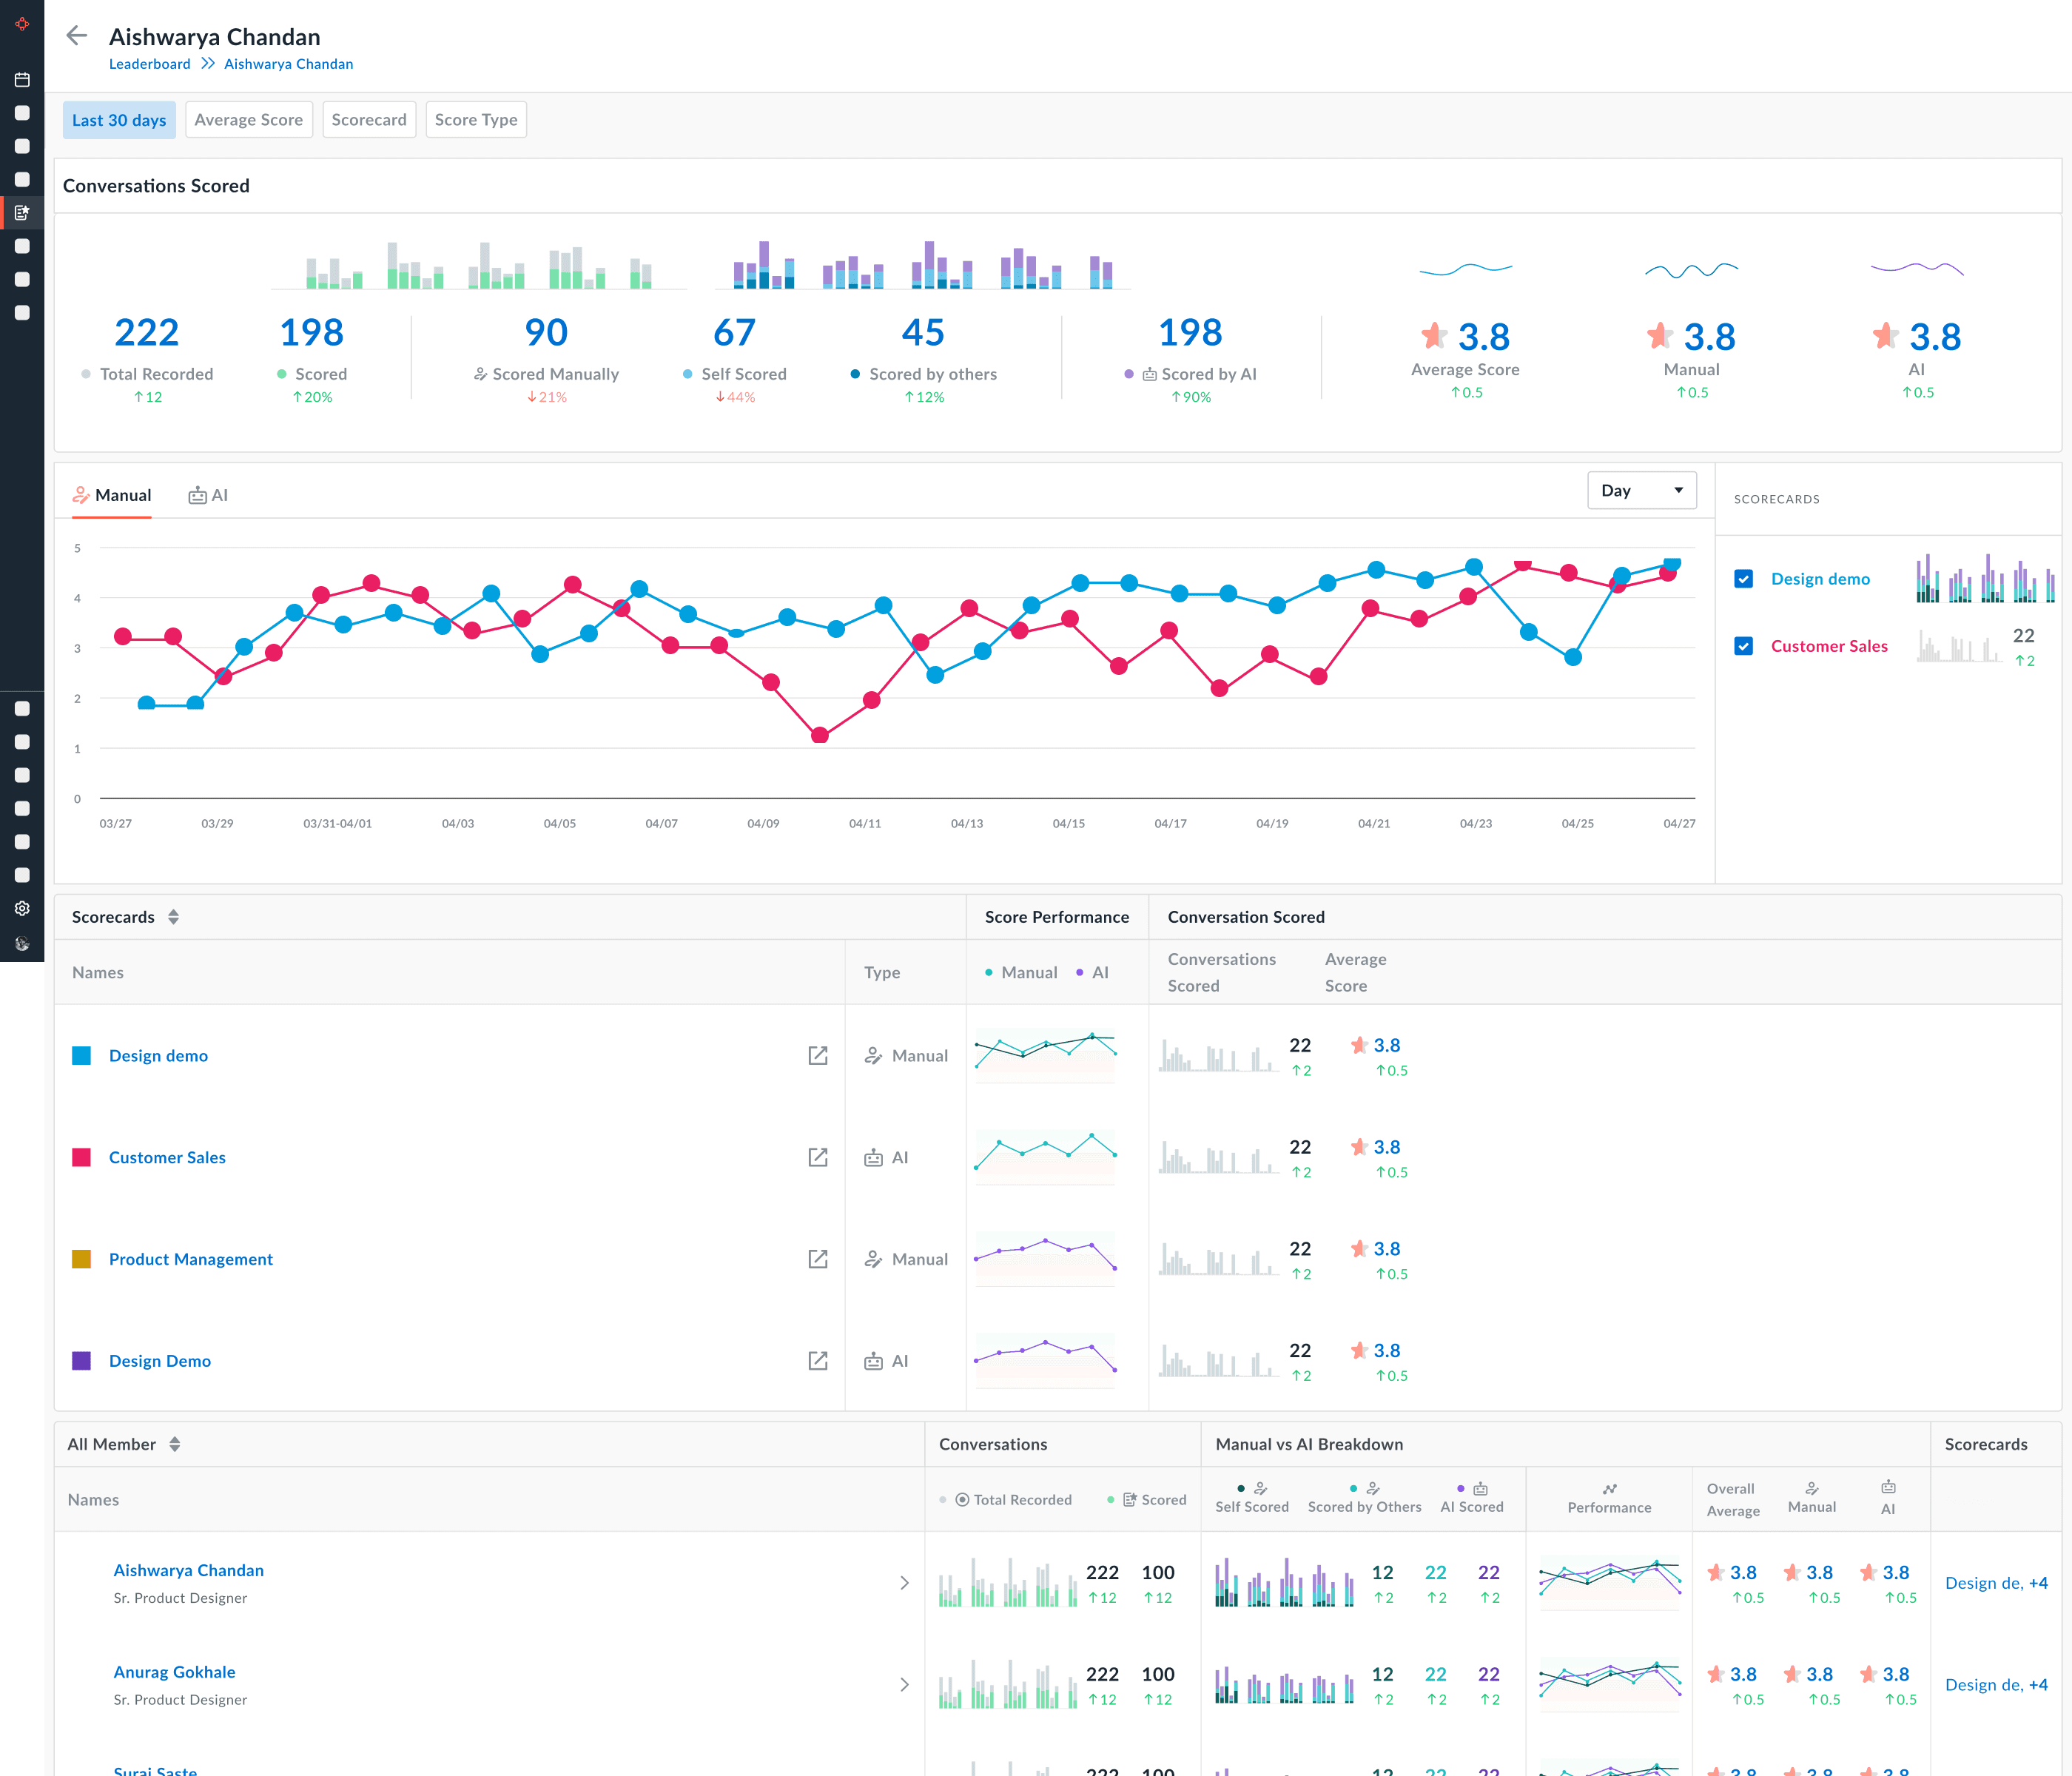
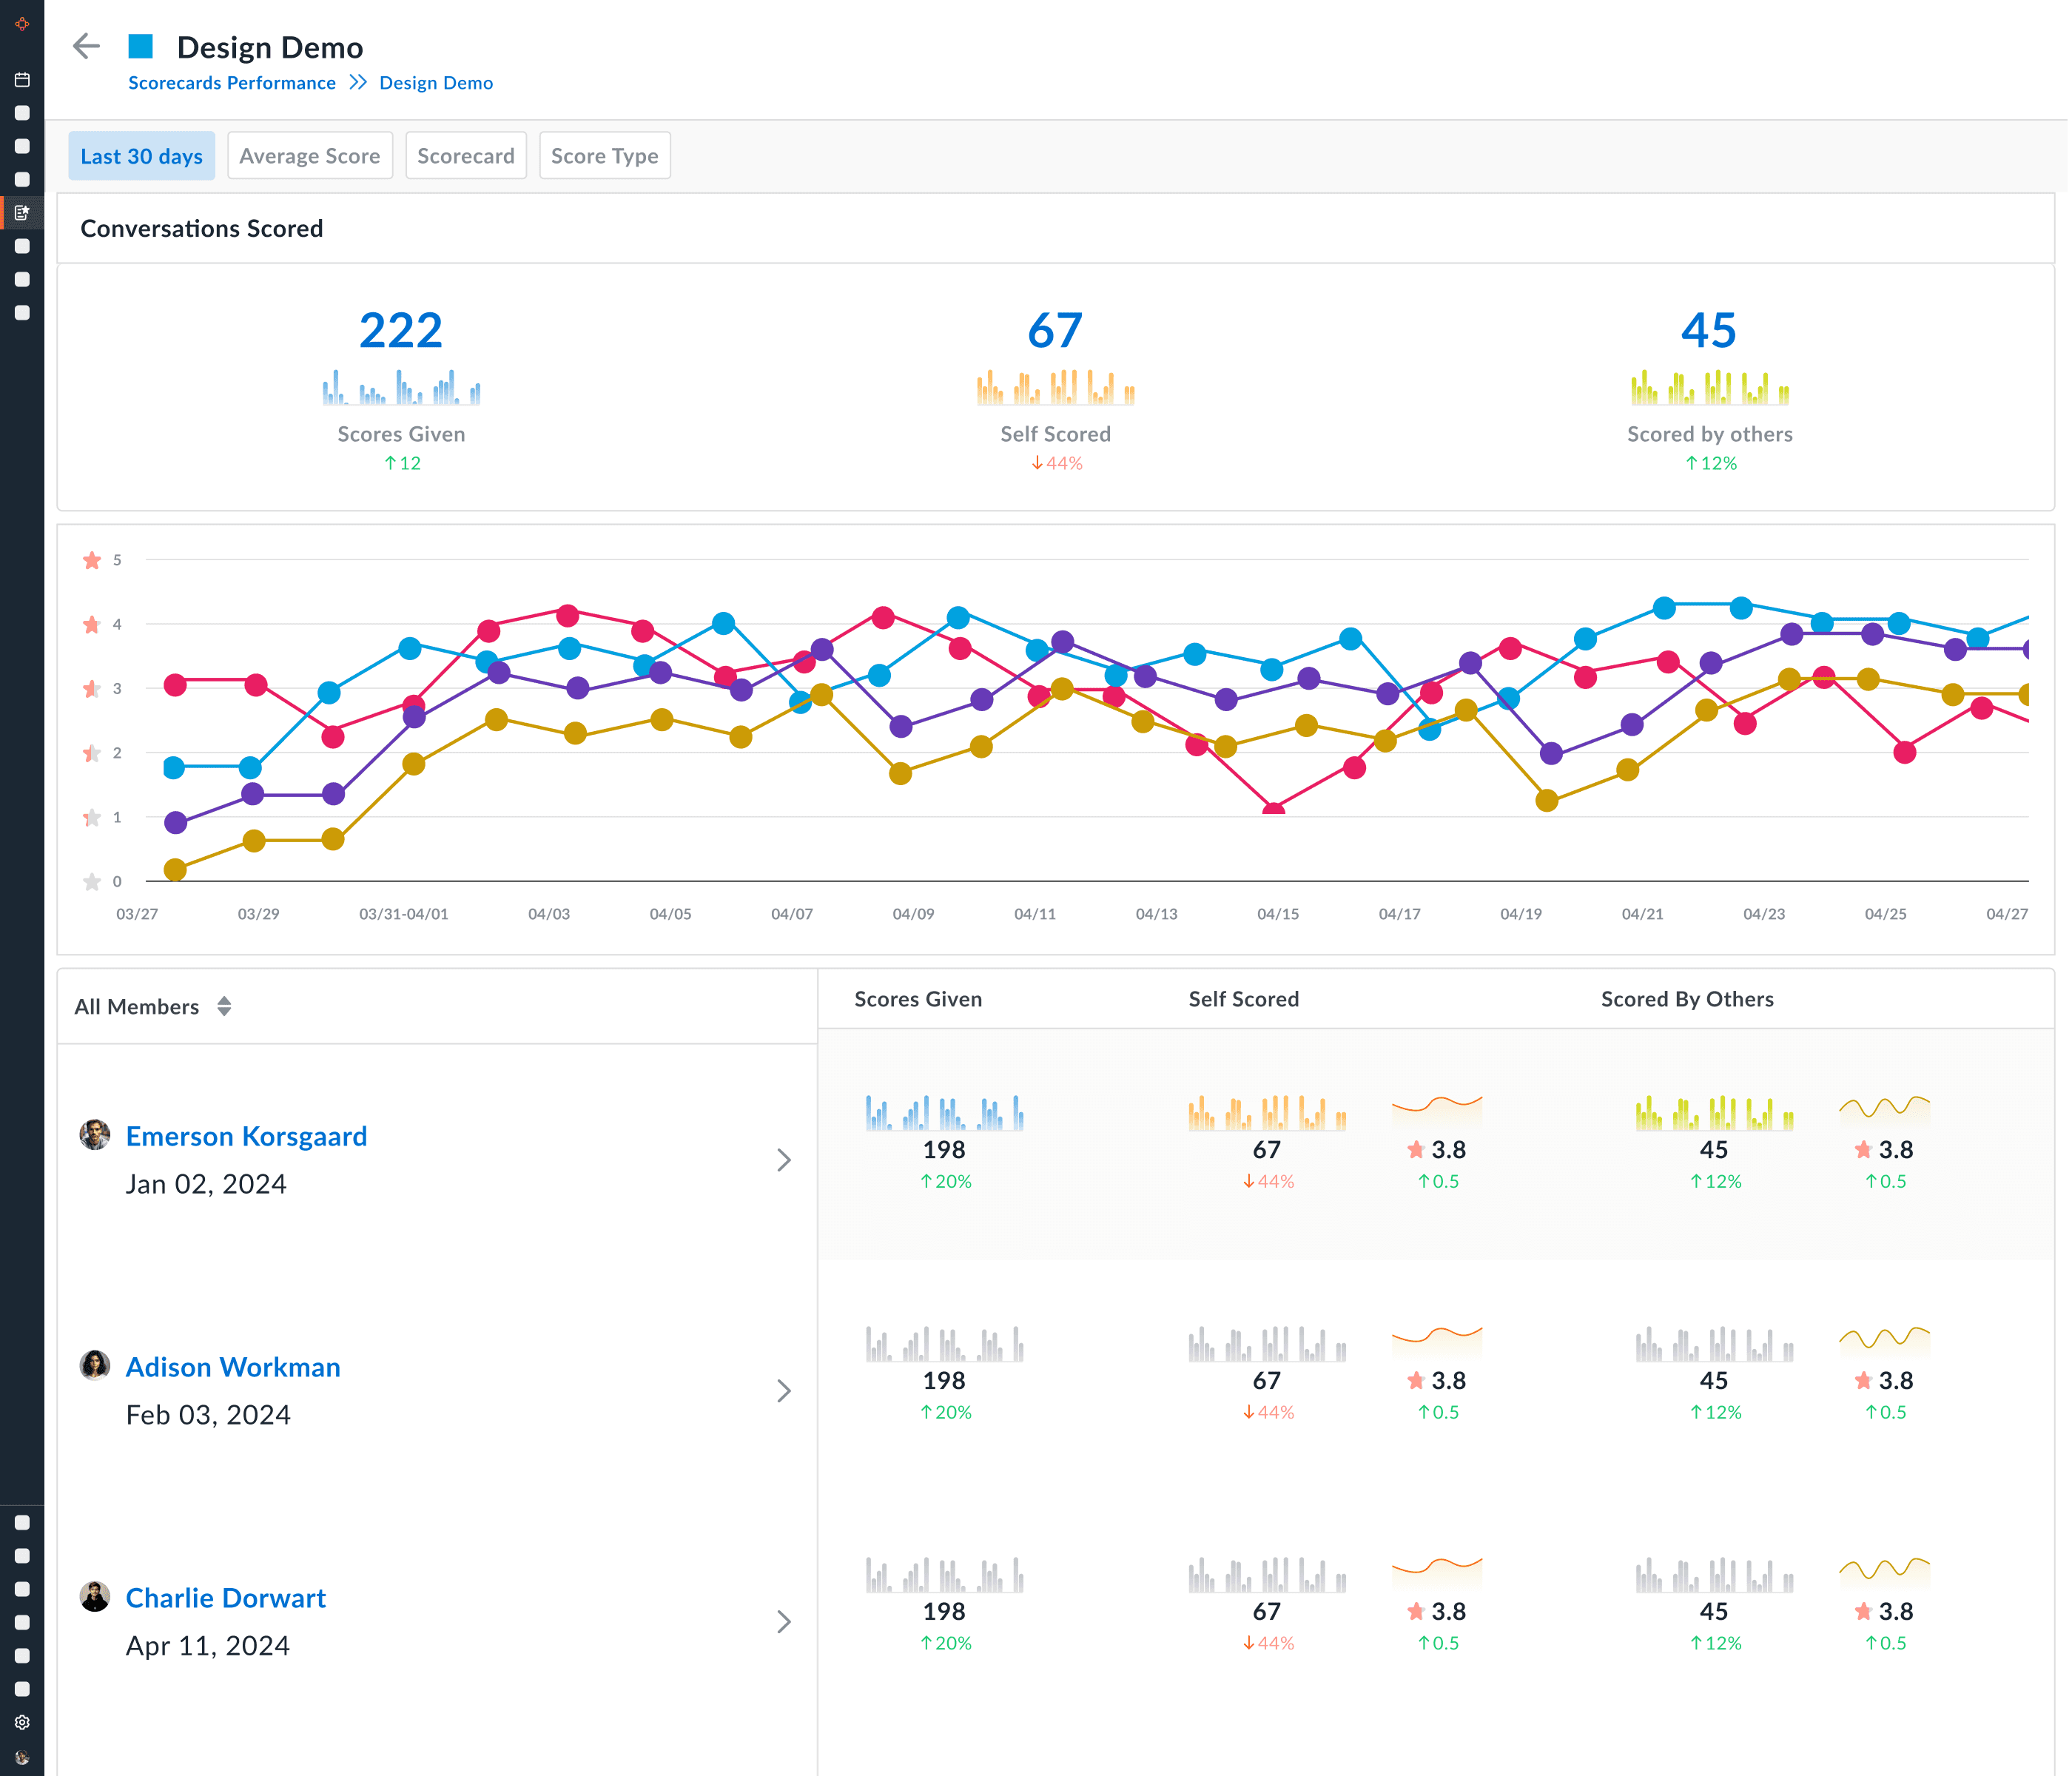
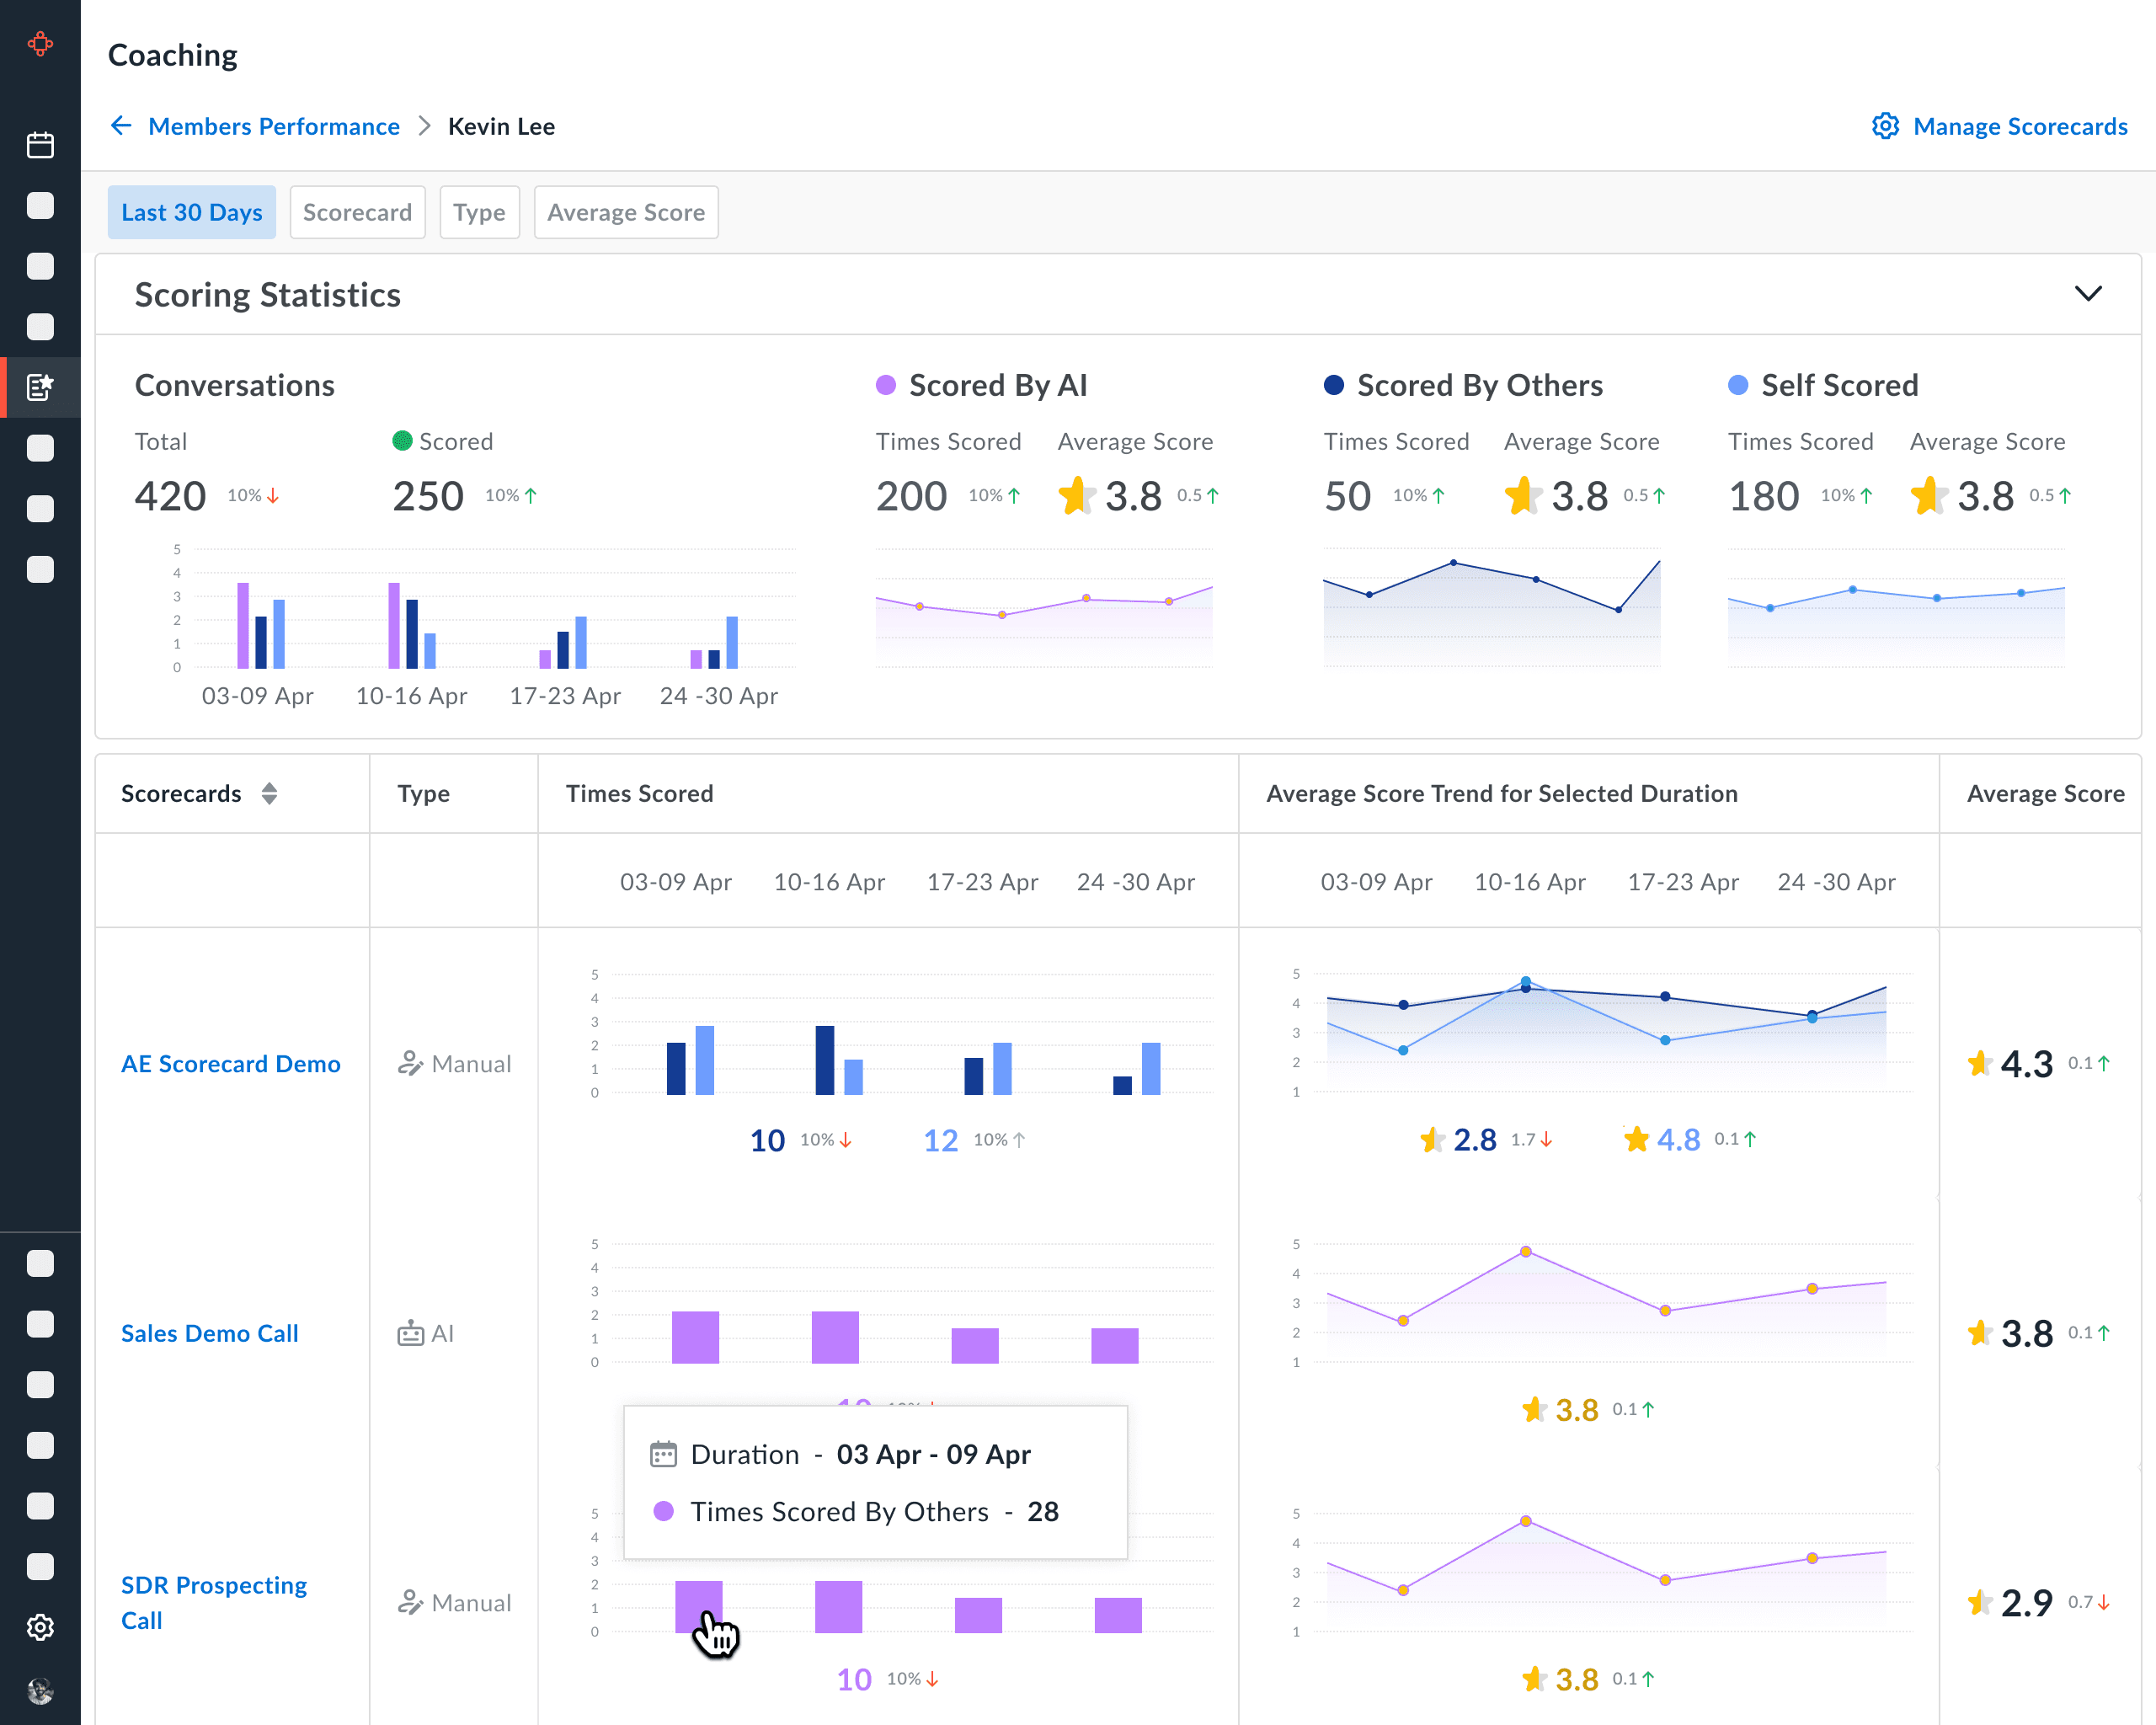
How I solved it!
Introduced skill-wise trend lines over time
Shifted from call-based scoring → improvement tracking
Enabled managers to see if coaching was actually working
Coaching became developmental, not evaluative.
Coaching Measurable with Trends

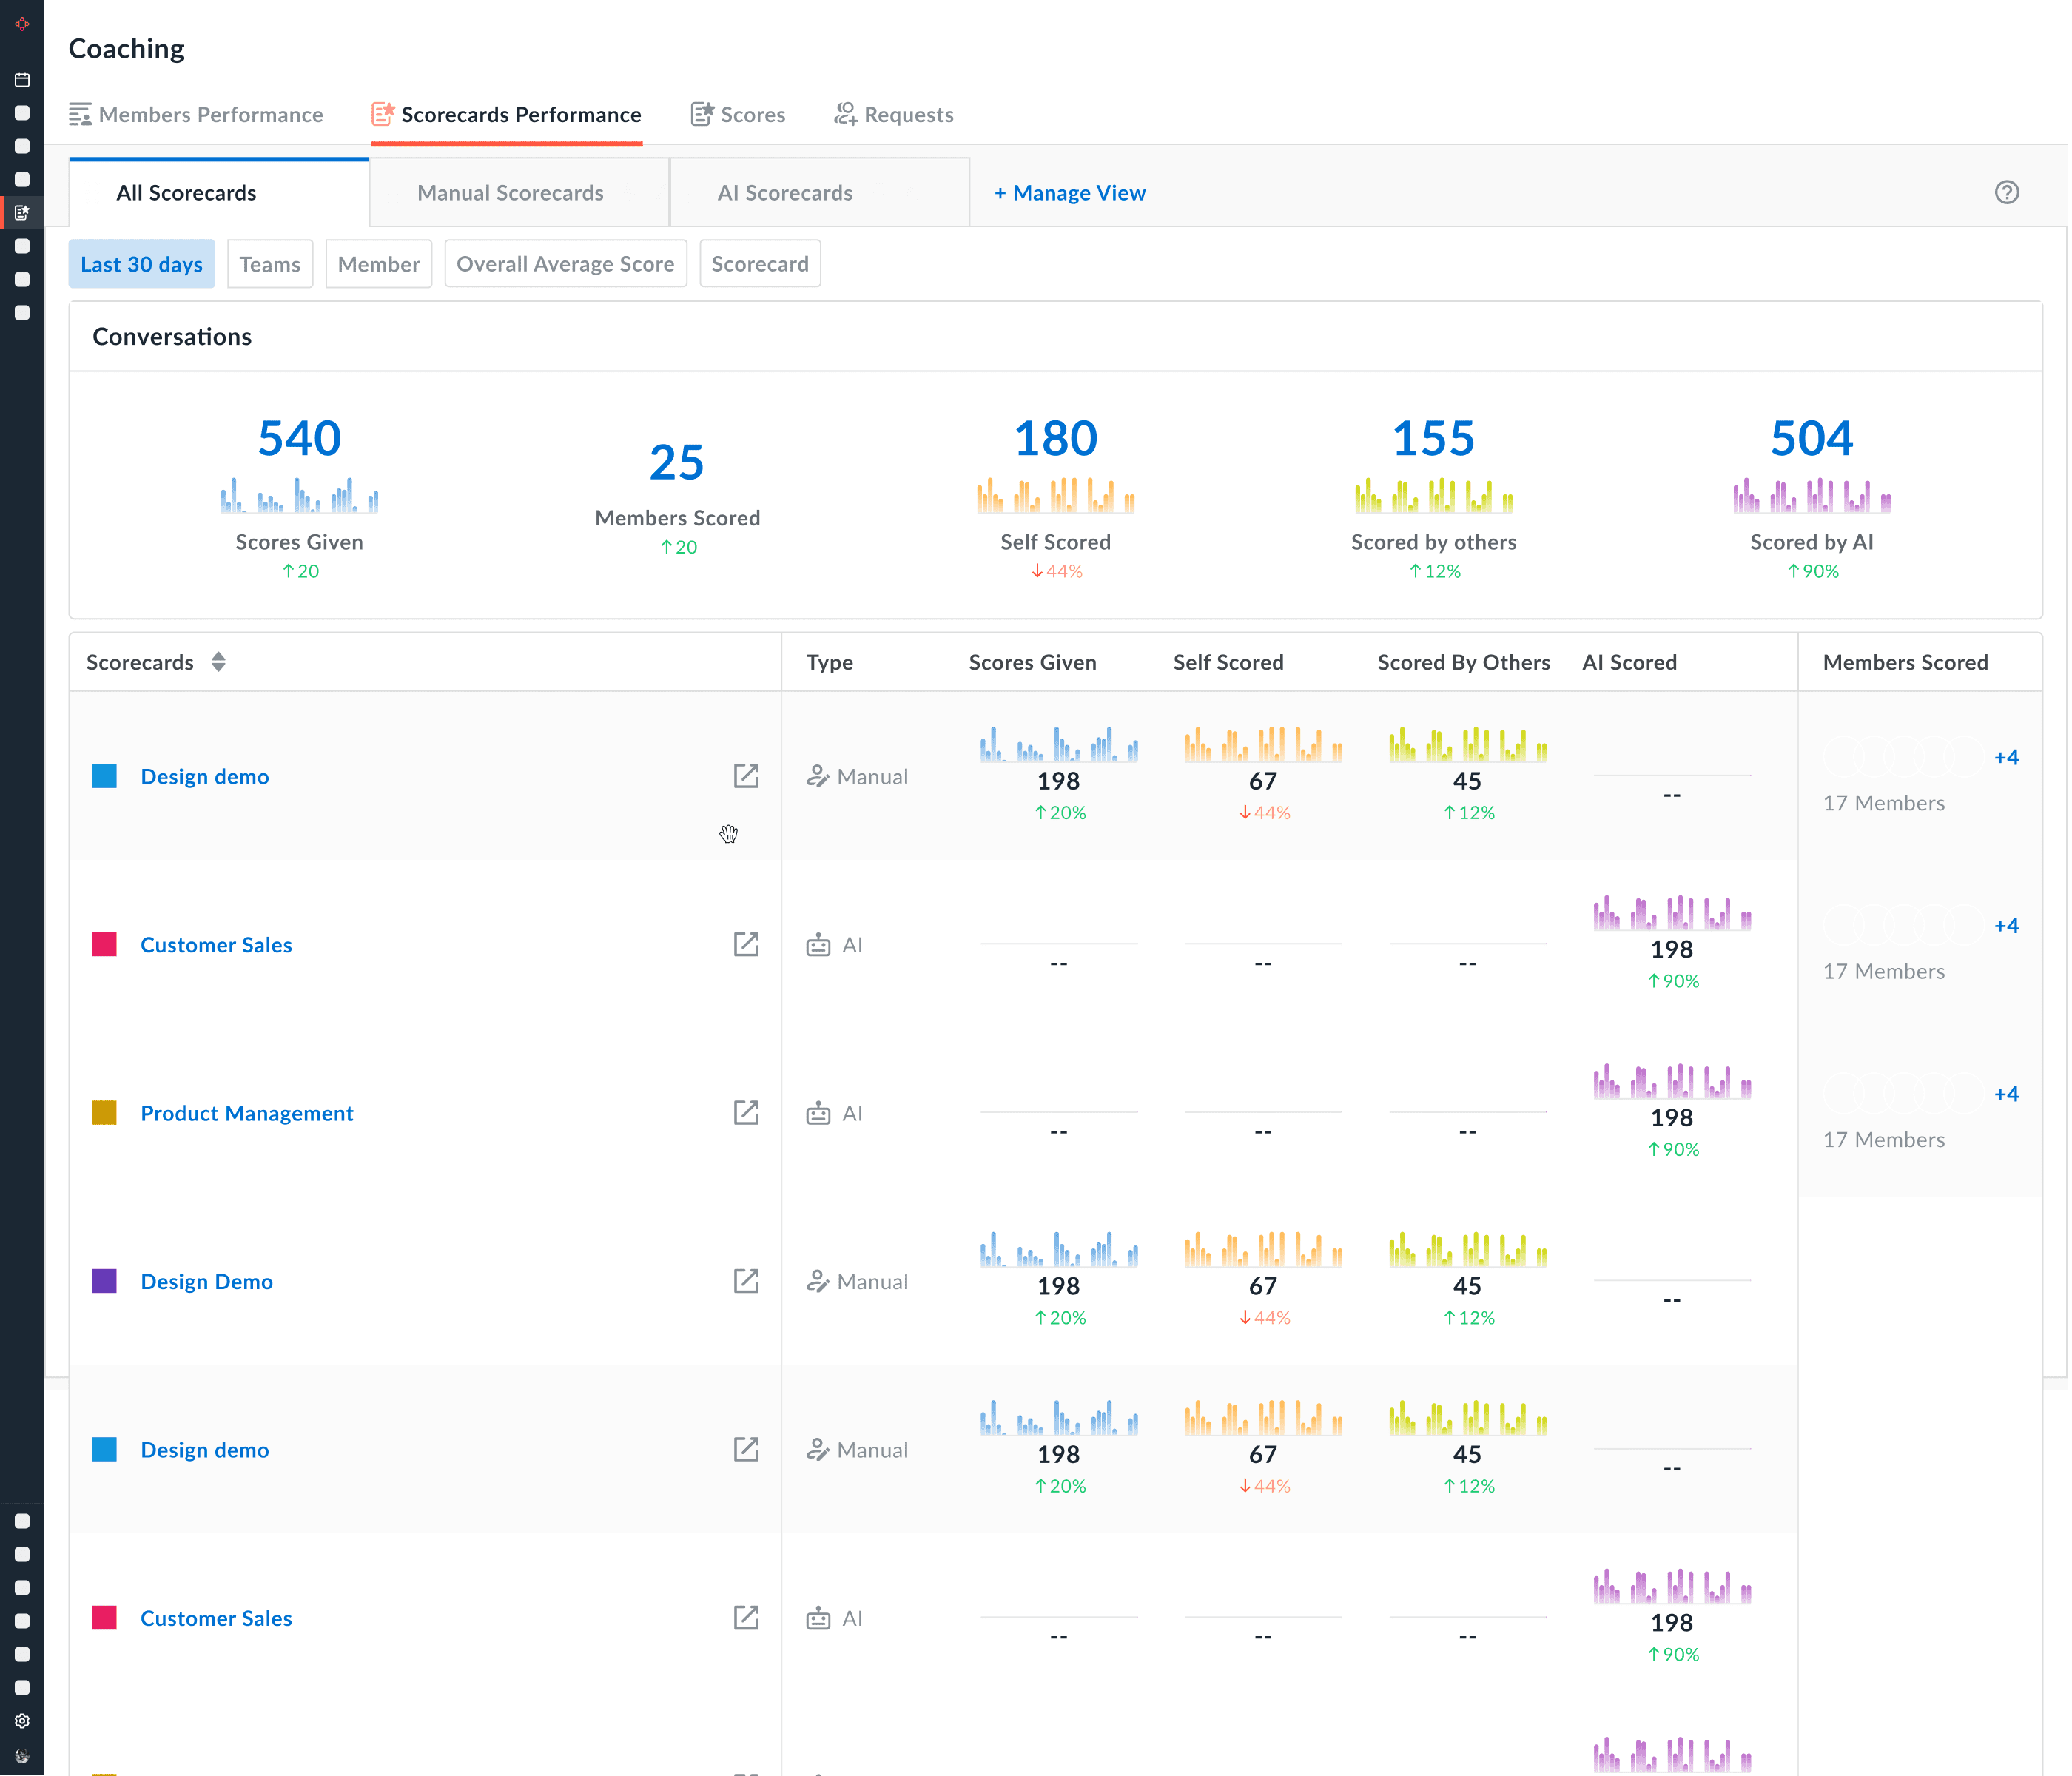
Visulise Coaching Frequency

Added bar charts for number of times each rep was scored
Surfaced distribution gaps across team members
Made coaching activity itself visible
Ensured consistent feedback and reduced bias.
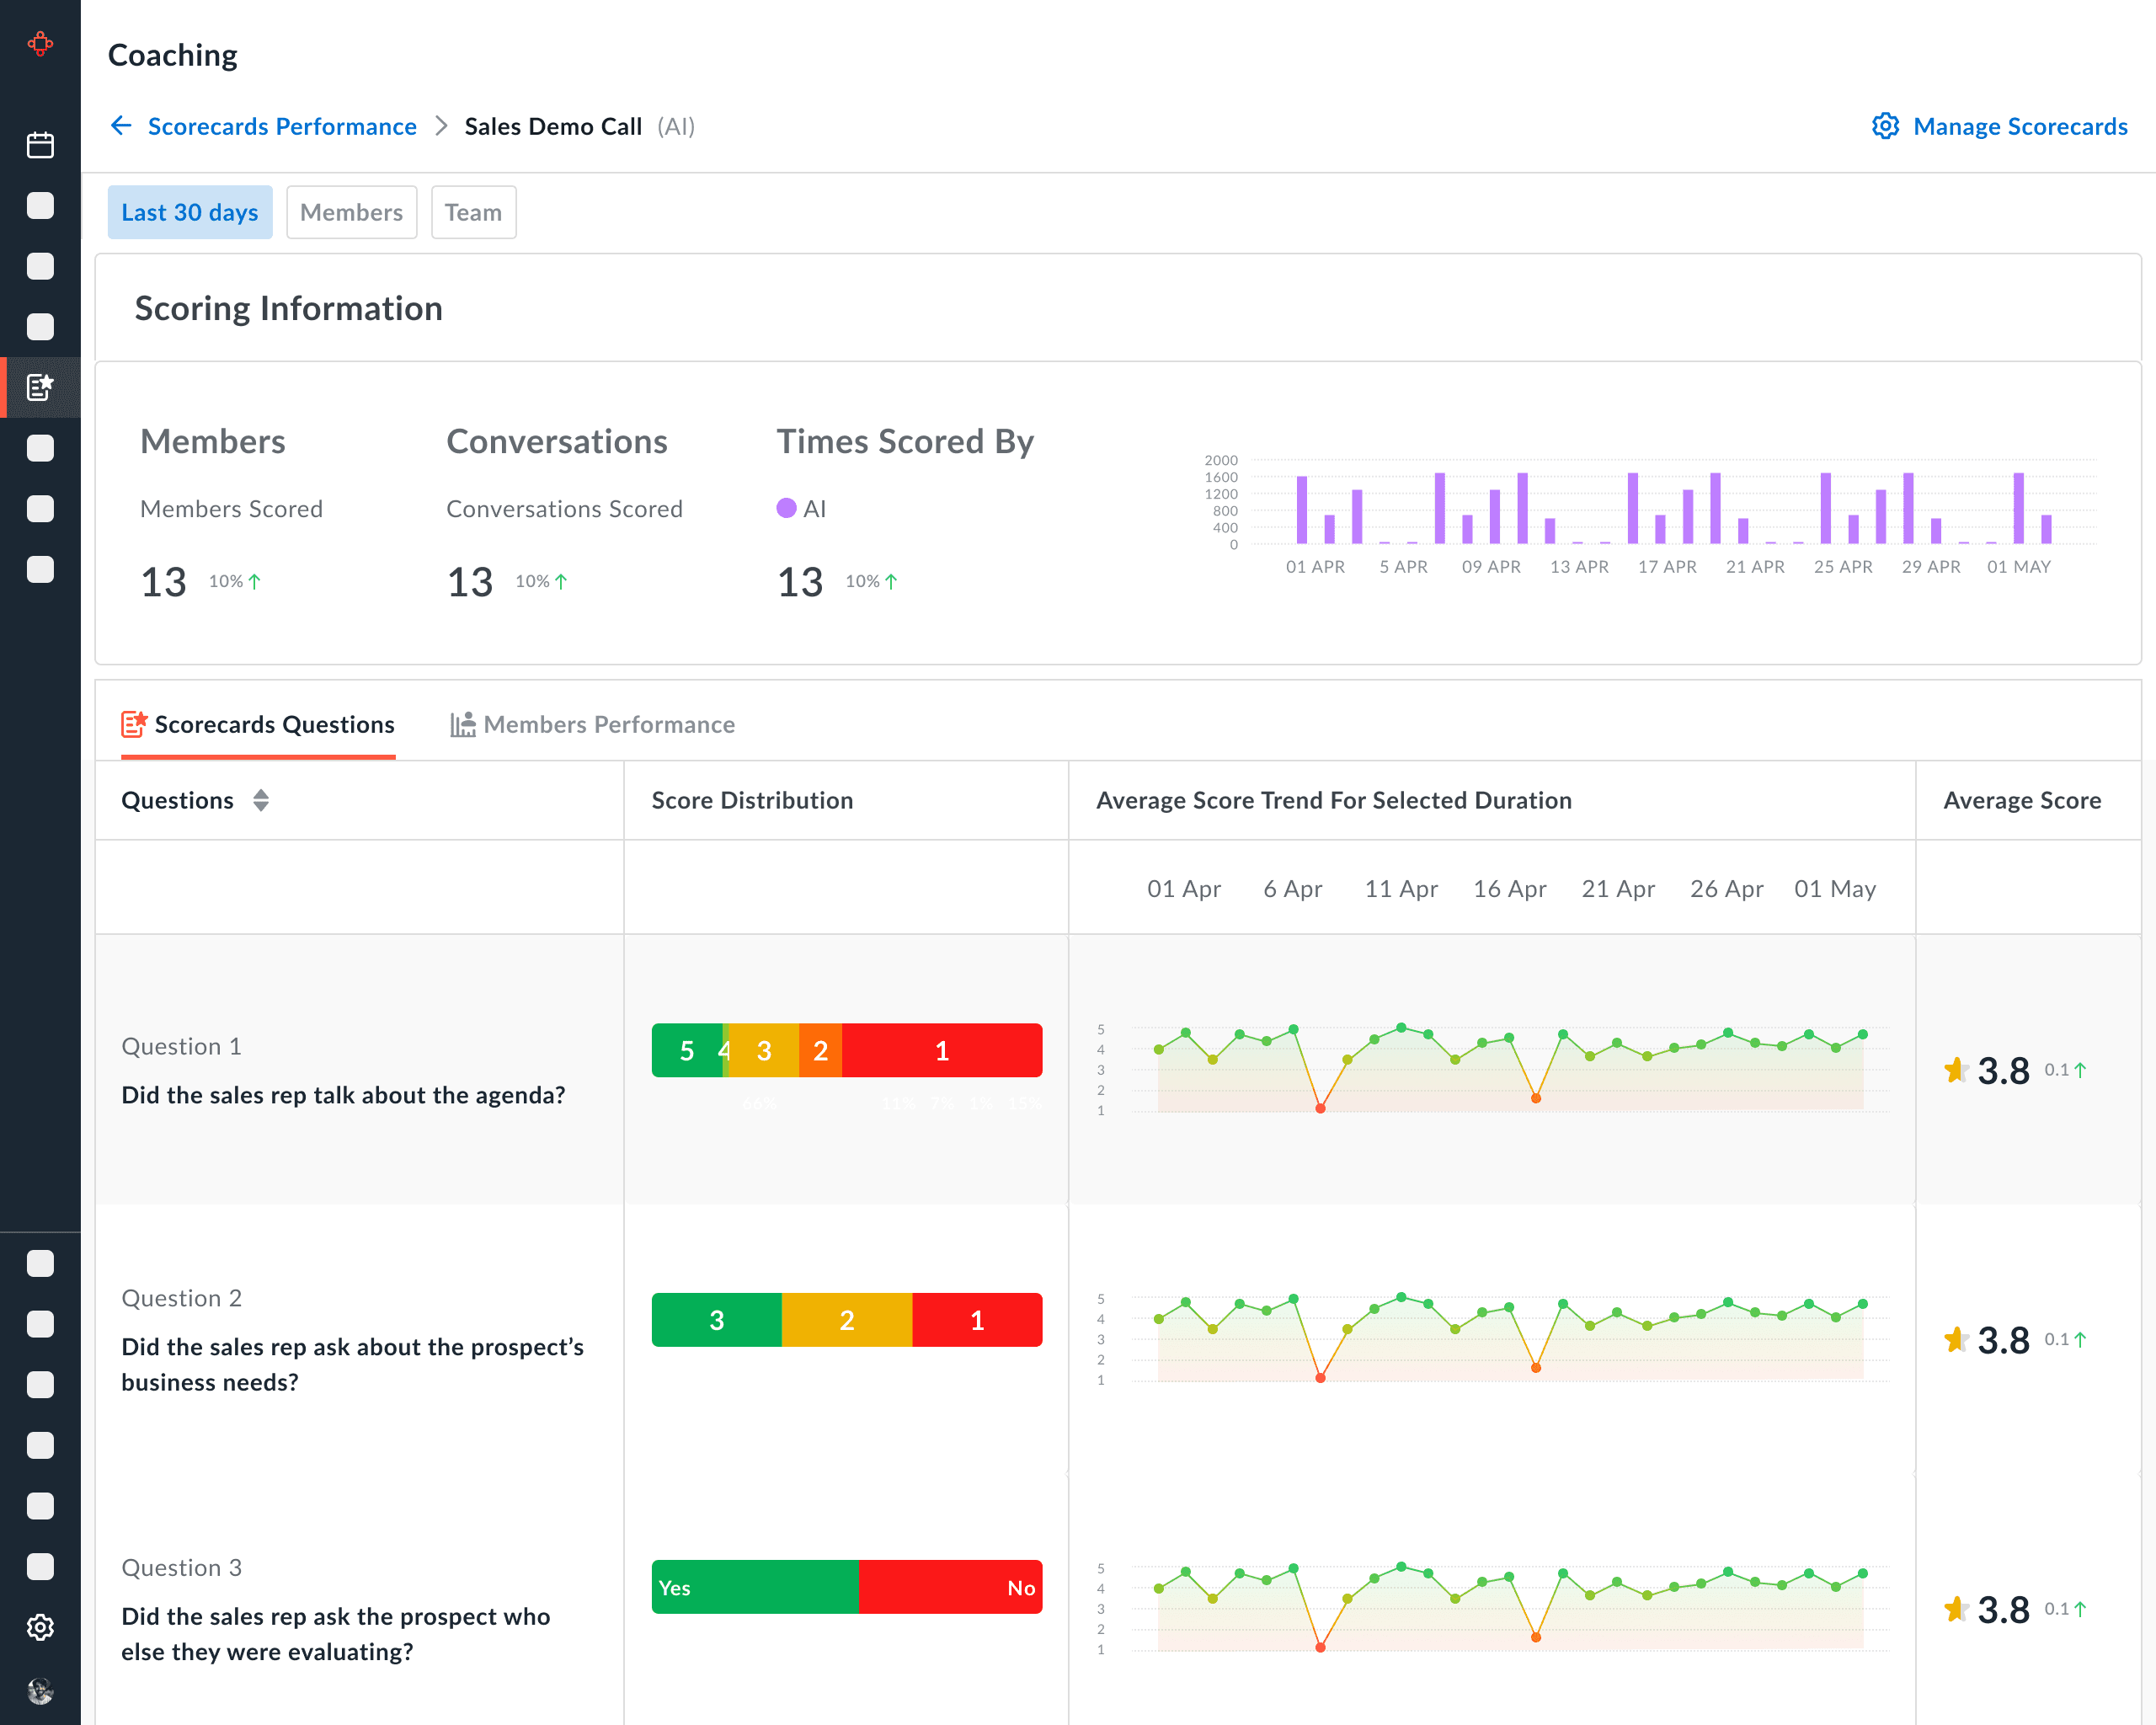
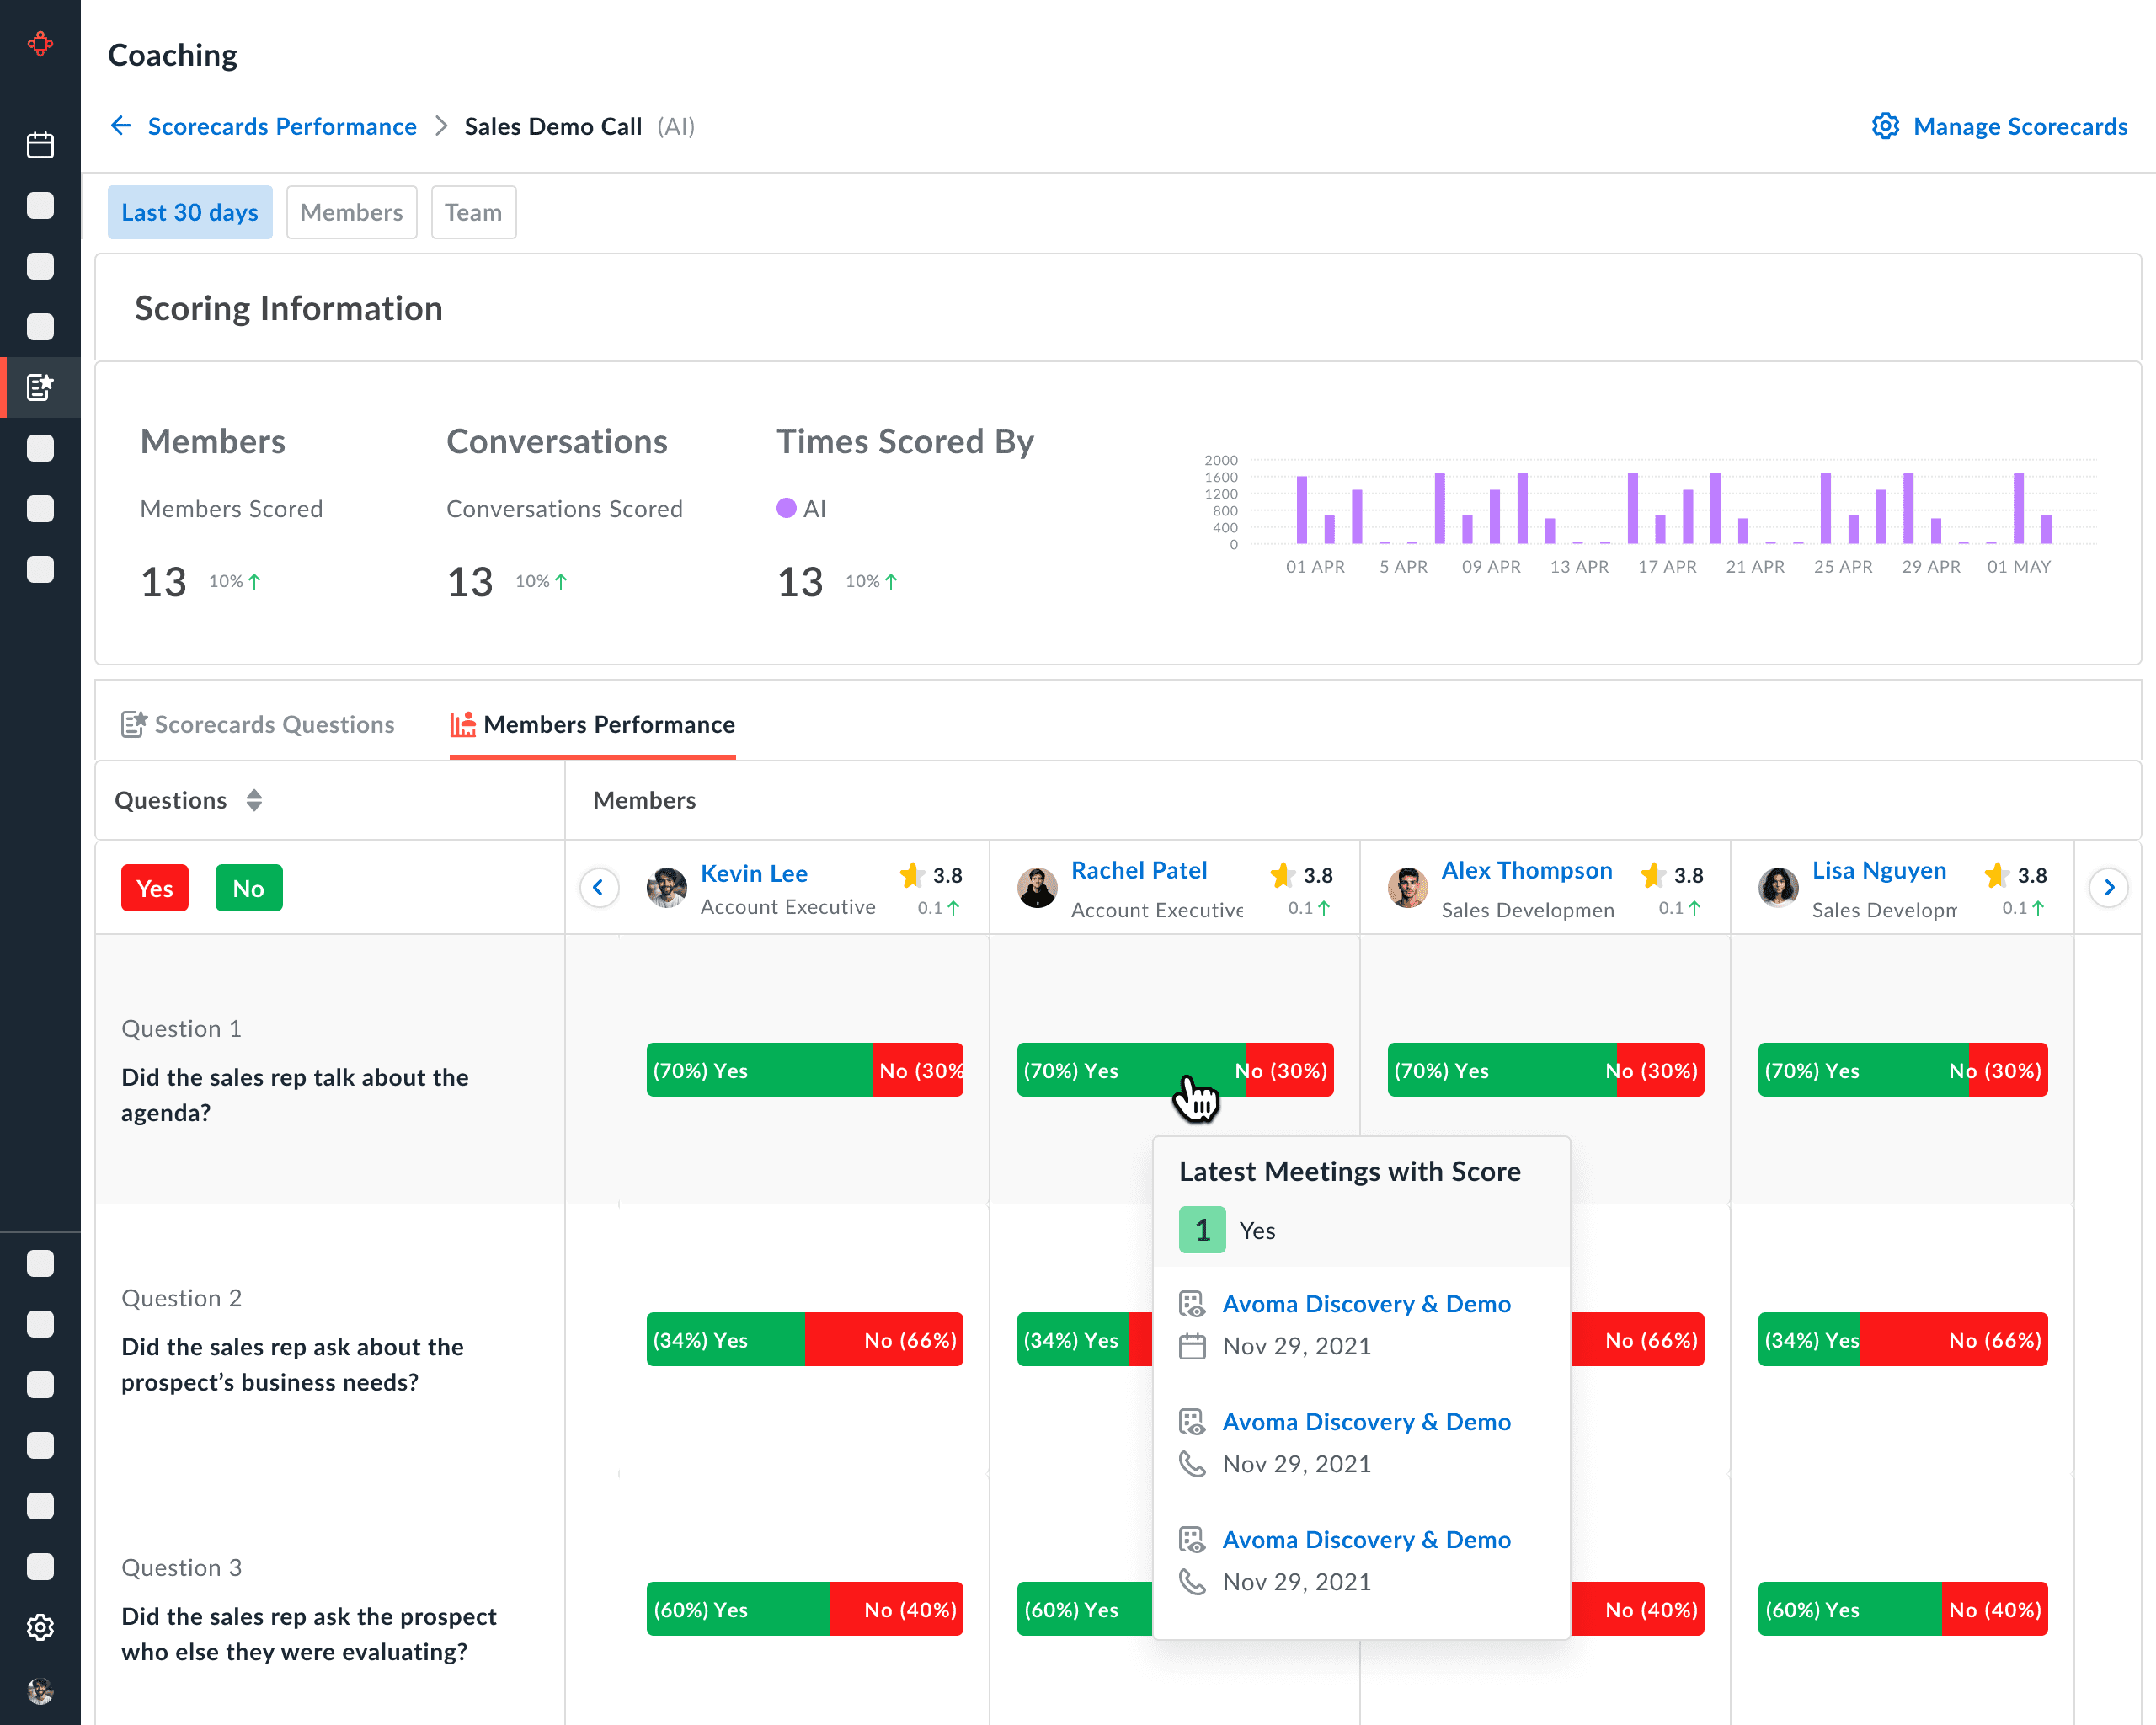
Question level Granularity

Introduced criterion-wise performance breakdown
Allowed drill-down into specific behavioral dimensions
Moved beyond overall average scores
Managers could coach precisely, not generically.
Reframed Information Architecture

Reduced cognitive overload and guided action.
Restructured dashboards into 3 layers:
Overview: Team health & outliers
Individual: Progress & benchmarks
Diagnostic: Question-level insights
Flow: What’s happening → Who → Why → What to fix
How I solved it!
Introduced skill-wise trend lines over time
Shifted from call-based scoring → improvement tracking
Enabled managers to see if coaching was actually working
Coaching became developmental, not evaluative.
Coaching Measurable with Trends
Visulise Coaching Frequency
Added bar charts for number of times each rep was scored
Surfaced distribution gaps across team members
Made coaching activity itself visible
Ensured consistent feedback and reduced bias.
Question level Granularity
Introduced criterion-wise performance breakdown
Allowed drill-down into specific behavioral dimensions
Moved beyond overall average scores
Managers could coach precisely, not generically.
Reframed Information Architecture
Reduced cognitive overload and guided action.
Restructured dashboards into 3 layers:
Overview: Team health & outliers
Individual: Progress & benchmarks
Diagnostic: Question-level insights
Flow: What’s happening → Who → Why → What to fix
Wireframes
Deliverables
Rep-level performance scores
Skill/category breakdown
Historical trends
Call-level drill-down
Team performance overview
What Improved
Centralized coaching insights in one place
Reduced manual call reviews
Enabled objective performance tracking
Introduced AI-driven evaluation as a scalable system
Version 1
Core architecture & Visuals


Version 1
Core architecture & Visuals
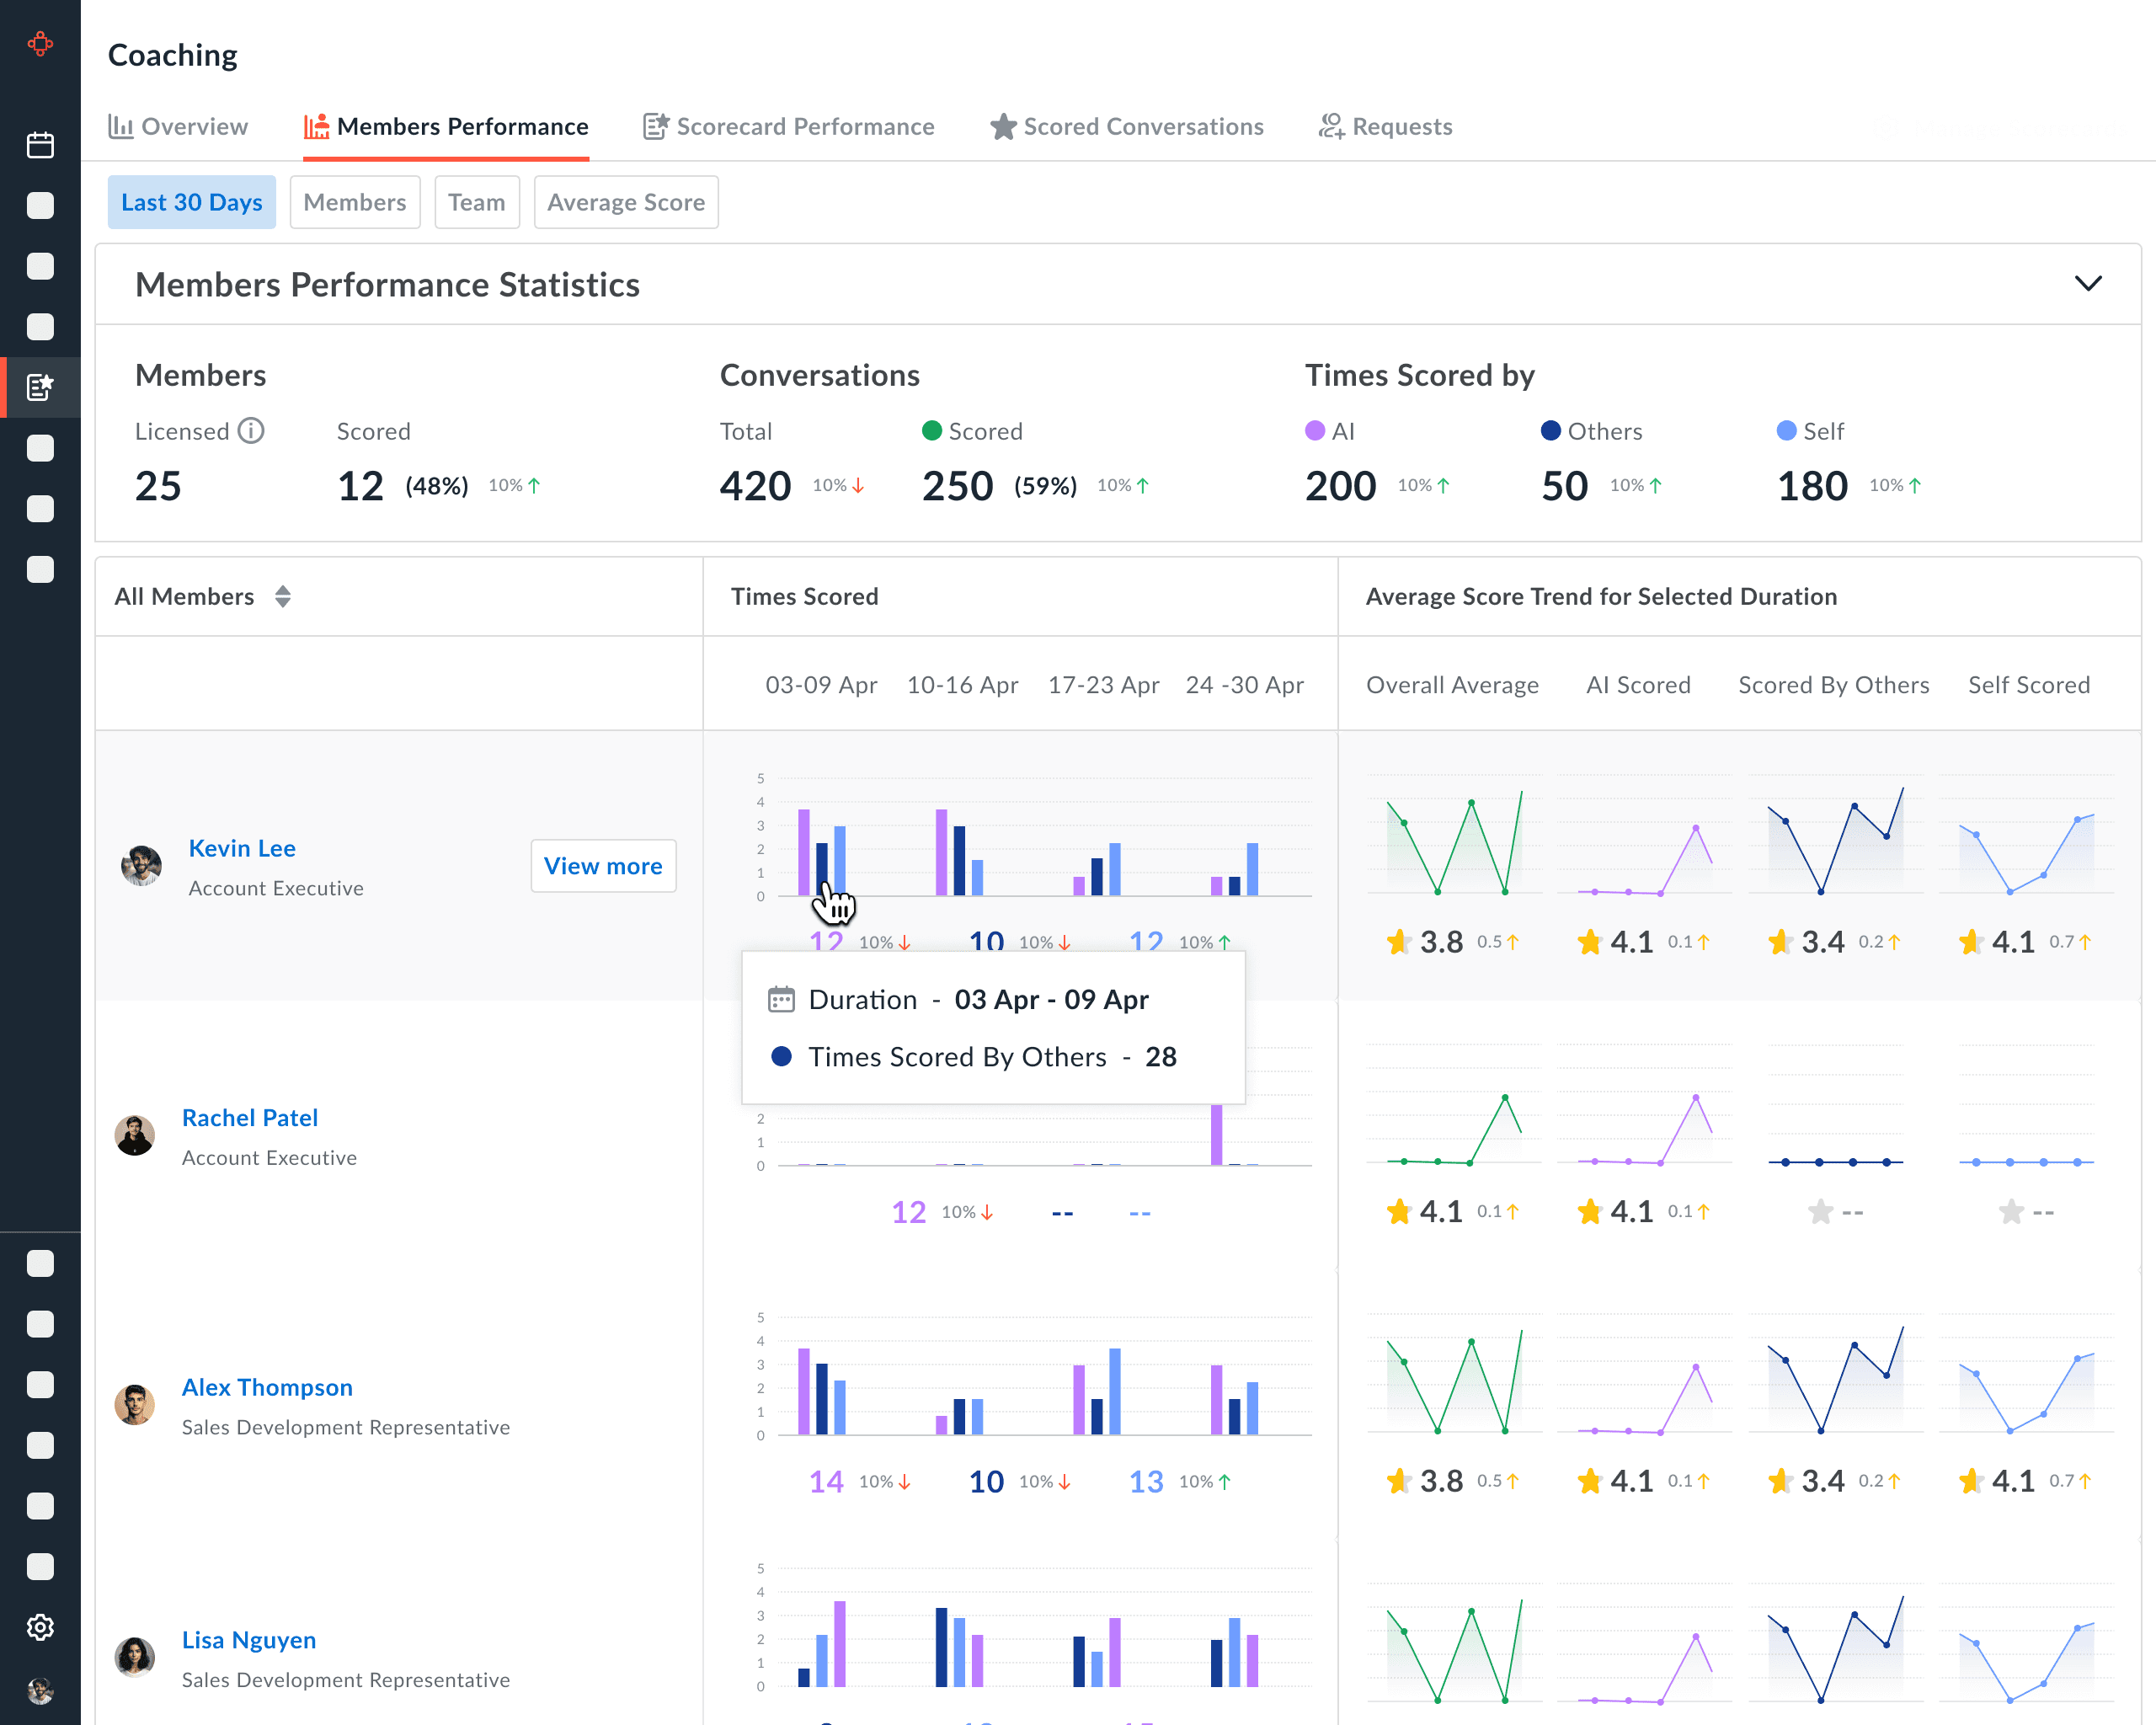
What Version 1 Was NOT Solving
2. Prioritization Problem
Managers still asked: “Where should I focus first?”
Context Gap
Low score → but no quick answer to:
Which skill is the issue?
Is performance improving or declining?
Is this an isolated case or pattern?
Cognitive Load
Equal visual weight
Hard to scan during weekly reviews
What Version 1 Was NOT Solving
1. Prioritization Problem
Managers still asked: “Where should I focus first?” All reps looked similar. No clear risk signals.
Context Gap
Low score → but no quick answer to:
Which skill is the issue?
Is performance improving or declining?
Is this an isolated case or pattern?
Cognitive Load
Equal visual weight
Hard to scan during weekly reviews
Cognitive Load
Too many metrics
Equal visual weight
Hard to scan during weekly reviews
Limited Enterprise Flexibility
Large teams needed:
Different evaluation dimensions
Custom coaching frameworks
Static structure didn’t scale.
Insight from Feedback & Usage
From customer calls and product usage:
Managers spent most time on team overview
Deep analytics were rarely explored
Weekly workflow = scan → identify risk → coach
High-performing teams also wanted recognition visibility
Version 2
Action-Focused Coaching
Shift from performance reporting to coaching prioritization.
Version 2
Action-Focused Coaching
Shift from performance reporting to coaching prioritization.
What Version 2 Was NOT Solving
Better architecture wise, still needs improvements on visuals
Too many charts, increasing cognitive load
Has accessibility issues, very less area to hover on charts
What Version 2 Was NOT Solving
Better architecture wise, still needs improvements on visuals
Too many charts, increasing cognitive load
Has accessibility issues, very less area to hover on charts
Final Version
"Overview"

Final Version
"Overview"
"Members Performance"


"Members Performance"
"Scorecards Performance"


"Scorecards Performance"
What Business Metric Improved?
Structured dashboards increased manager engagement with scorecards.
↑ Scorecard completion rate
↑ Weekly coaching session frequency
↑ AI-generated insight usage
Coaching Adoption Increased

Reduced Manual Review Time
Managers could:
Identify underperforming skills quickly
Focus on high-impact calls
Avoid reviewing every recording
Higher AI Feature Adoption
By visualizing insights:
AI coaching moved from passive to actionable
More teams adopted structured evaluation
Improved Rep skill Visibility
Reps could:
See behavior trends
Track improvement over time
Compare against benchmarks
This increased:
Accountability
Self-coaching
Engagement
That’s product impact.
What Business Metric Improved?
Structured dashboards increased manager engagement with scorecards.
↑ Scorecard completion rate
↑ Weekly coaching session frequency
↑ AI-generated insight usage
Coaching Adoption Increased
Reduced Manual Review Time
Managers could:
Identify underperforming skills quickly
Focus on high-impact calls
Avoid reviewing every recording
Higher AI Feature Adoption
By visualizing insights:
AI coaching moved from passive to actionable
More teams adopted structured evaluation
Improved Rep skill Visibility
Reps could:
See behavior trends
Track improvement over time
Compare against benchmarks
This increased:
Accountability
Self-coaching
Engagement
That’s product impact.
Customer
Feedback

Customer Feedback
Avoma Scorecards & Dashboards
Watch Product Video
Watch my intro + this case-study
Key
Observations
Key Observations
Avoma Scorecards & Dashboards
Watch Product Video
Watch my intro + this case-study
Relevant
Links

Thank You!
Relevant Links
Thank You!
Relevant Links
Thank You!
Avoma AI Coaching Assistant
Relevant Case-study
Relevant Case-study

Other Case-studies
Other Case-studies
© Feb 2026 Aishwarya Chandan
© Feb 2026 Aishwarya Chandan
© Feb 2026 Aishwarya Chandan